About EME Observer
EME Observer is a web application that provides an interactive map of Earth-Moon-Earth (EME) stations and enables one-click sked planning and real-time tracking of moon footprint and conditions. It delivers high-resolution lunar ephemeris data and displays key signal-path characteristics, including additional path loss, libration rate, Doppler spread, and polarization offset, together with station profiles and statistical summaries. EME Observer supports all EME bands from 144 MHz to 76 GHz.
Key features include:
- Station locations with details such as transmit power, antennas, QRZ.com links, personal websites, email addresses, and station images (where available)
- One-click EME planner for all bands, 144 MHz and above, featuring visualizations of common Moon windows and signal-path characteristics - supports both Manual and Realtime tracking modes (1-minute tracking steps)
- Moon footprint, sublunar point, CQ Zones and QTH Locators overlay
- Moon distance, declination, and additional path loss
- Moon azimuth, elevation, topocentric libration rate, and Doppler spread on selected EME band for both your and the DX locations
- Relative libration rate, Doppler width (DXWidth), and spatial polarization offset (Dpol) between your and the DX locations
- Accurate Moonrise and Moonset times for your location and DX stations
- Moon–Sun angular separation and Moon-Sagittarius A separation for bands below 1 GHz, both with visual markers denoting potentially poor conditions
- Tabular station view with technical and contact details, including multi-field search capability
- Summary statistics covering power levels, antenna sizes, and DXCC distribution
EME Observer is platform-independent and performs equally well on desktop and mobile devices, making it easy to plan EME activity on the go. Note that it is not a link budget calculator. It will not tell you whether a QSO is possible with your particular setup, but understanding the data it presents can significantly improve your chances.
Data and Accuracy
EME Observer performs astronomical calculations using the Astronomy Engine, built on the VSOP87 and NOVAS C 3.1 models. In certain areas, an optimized version of the Meeus algorithm is used to improve performance without noticeable reduction in precision. See also licenses and credits.
All computations have been thoroughly validated against the Skyfield Python library using the DE421 ephemeris from NASA Jet Propulsion Laboratory (JPL). EME Observer achieves positional accuracy within 1 arcminute (0.017°), fully meeting the precision requirements for QSO planning and analysis across all EME bands, including the highest microwave frequencies.
Doppler spread calculations are based on methods described by J. Taylor K1JT, 2010, and spatial polarization offset (Dpol) follows the WSJT-X algorithm.
Station Data
Station data is contributed by the community. The 432 MHz and above database builds upon the excellent and dedicated work of Jan PA0PLY, who maintains a comprehensive list of active EME stations. The databases for 222 MHz and 902 MHz, bands that are almost entirely specific to ITU Region 2, are maintained by Martin PJ4MM. The 144 MHz database is maintained by Erwin DK5EW.
For stations operating on 432 MHz and higher bands (except 902 MHz), submit station details to the EME Directory maintained by Jan PA0PLY – click to email : https://www.pa0ply.nl/eme-directory/
For stations operating on 222 MHz and 902 MHz, send station updates to Martin PJ4MM – click to email - QRZ.com profile.
For stations operating on 144 MHz, send station updates to Erwin DK5EW – click to email - QRZ.com profile. We gratefully acknowledge the support of MMMonVHF for providing the initial 144MHz database.
Only include stations that have transmit (TX) capability and have completed at least one EME QSO on the band for which data is being submitted.
Send station pictures to Max
SA5IKN – click to email
-
QRZ.com profile. Please specify the band for which the image is intended. Each band may use a dedicated image, or the same image may be applied across all bands.
Quick Start
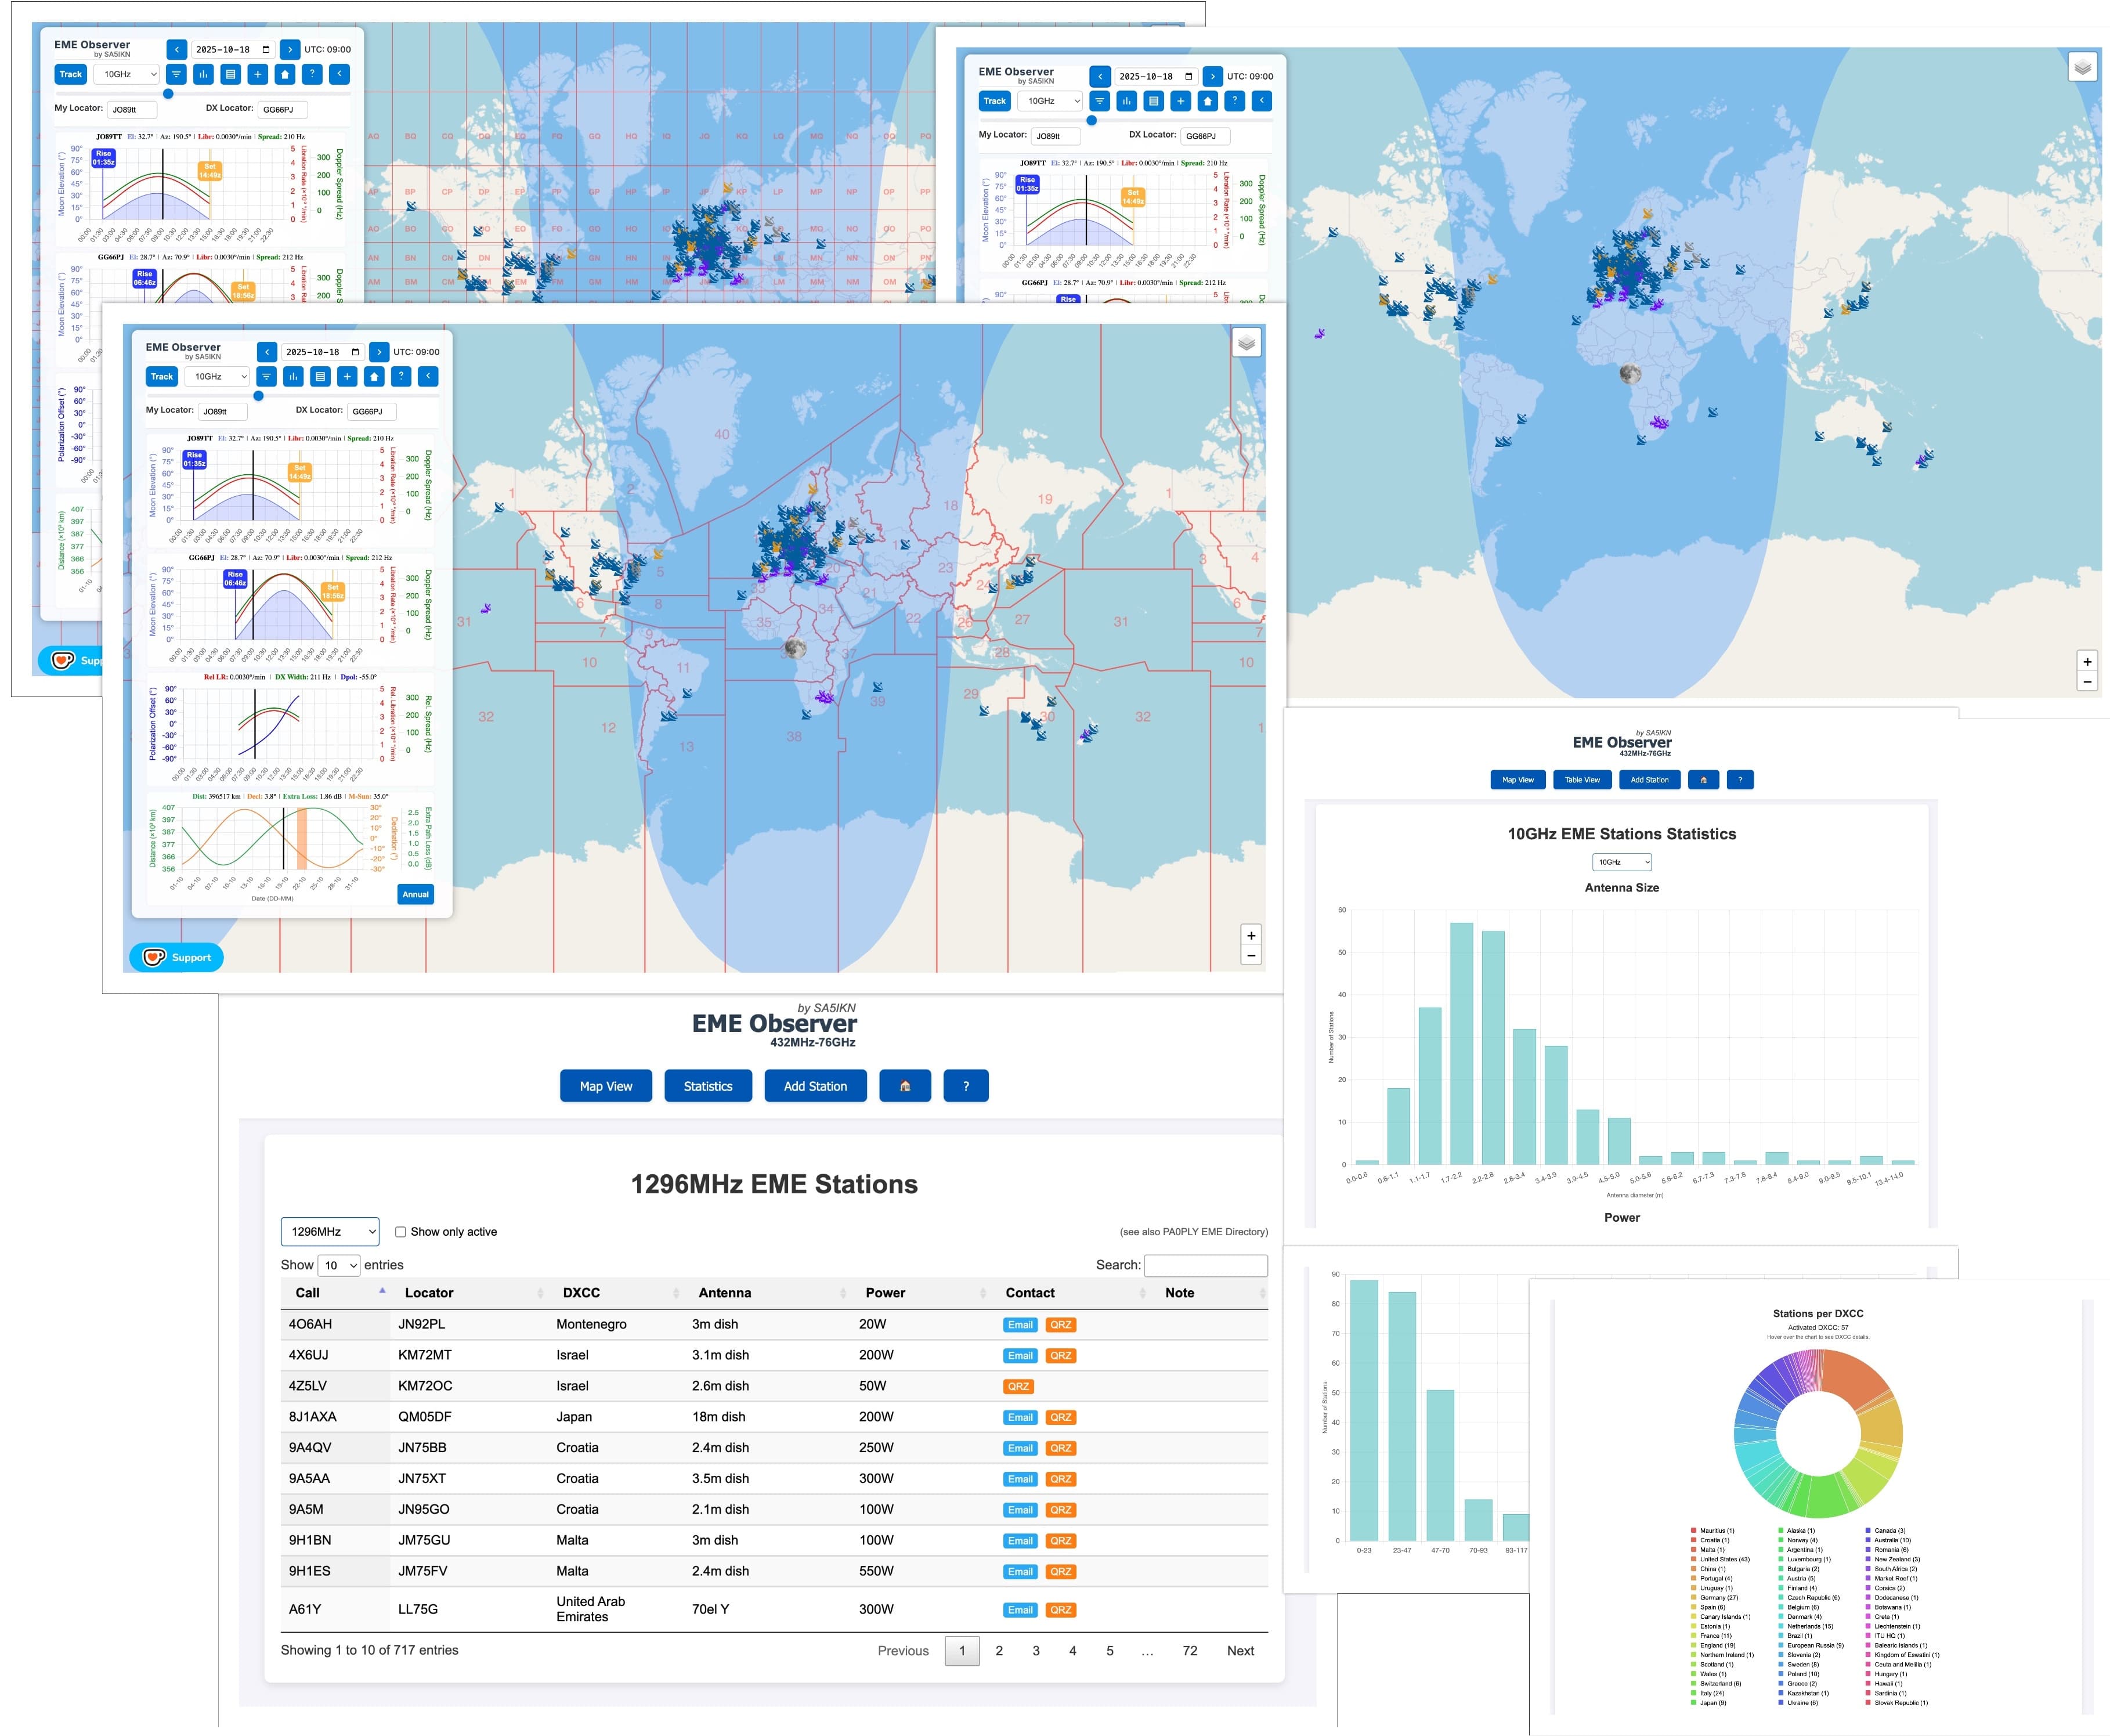
EME Observer offers three display modes: Map View, Table View, and Statistics View.
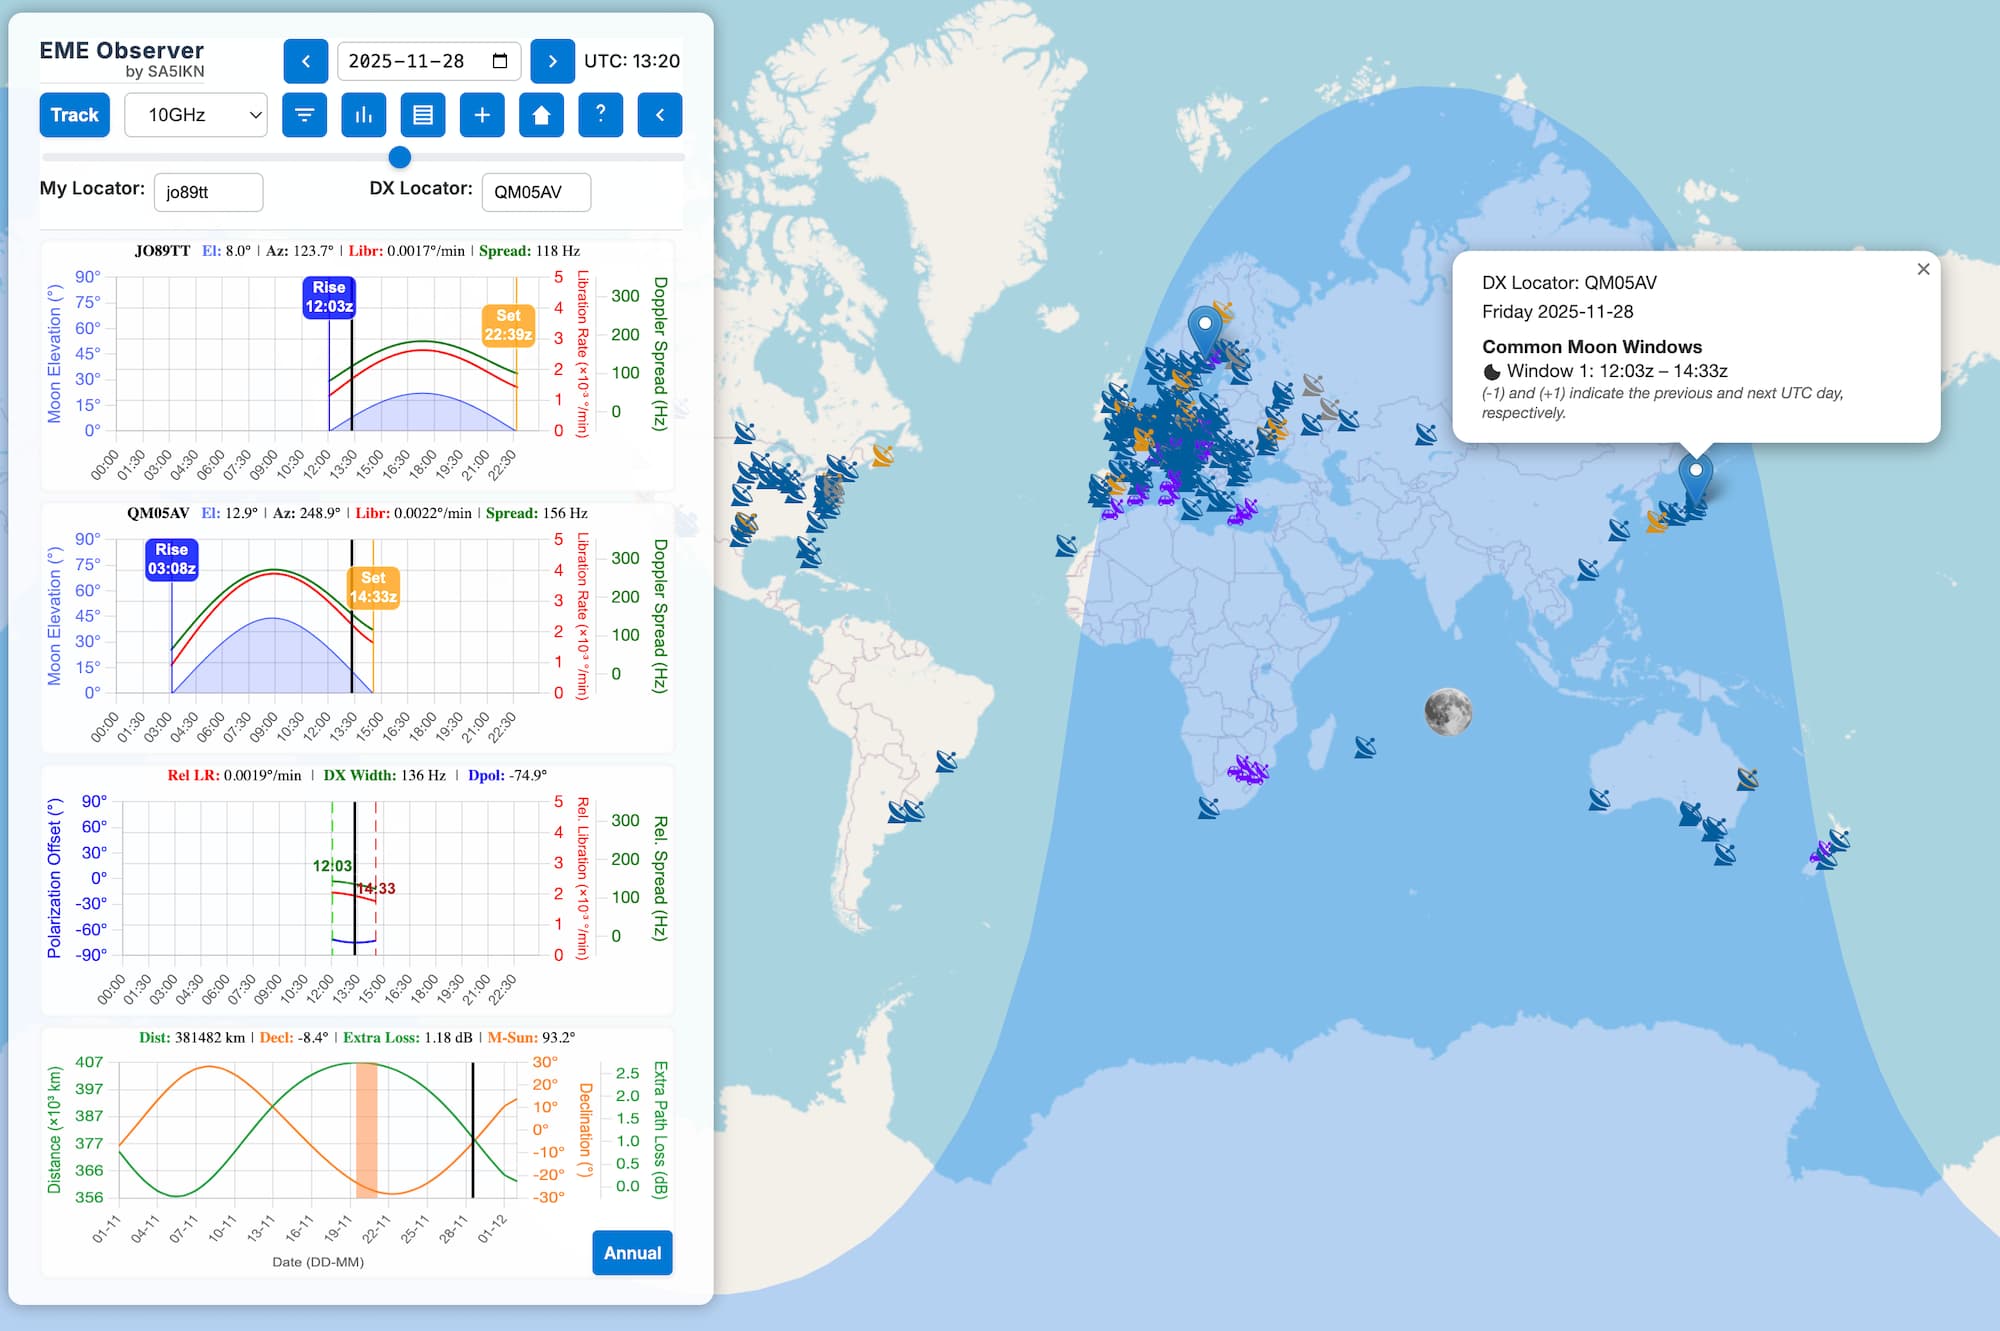
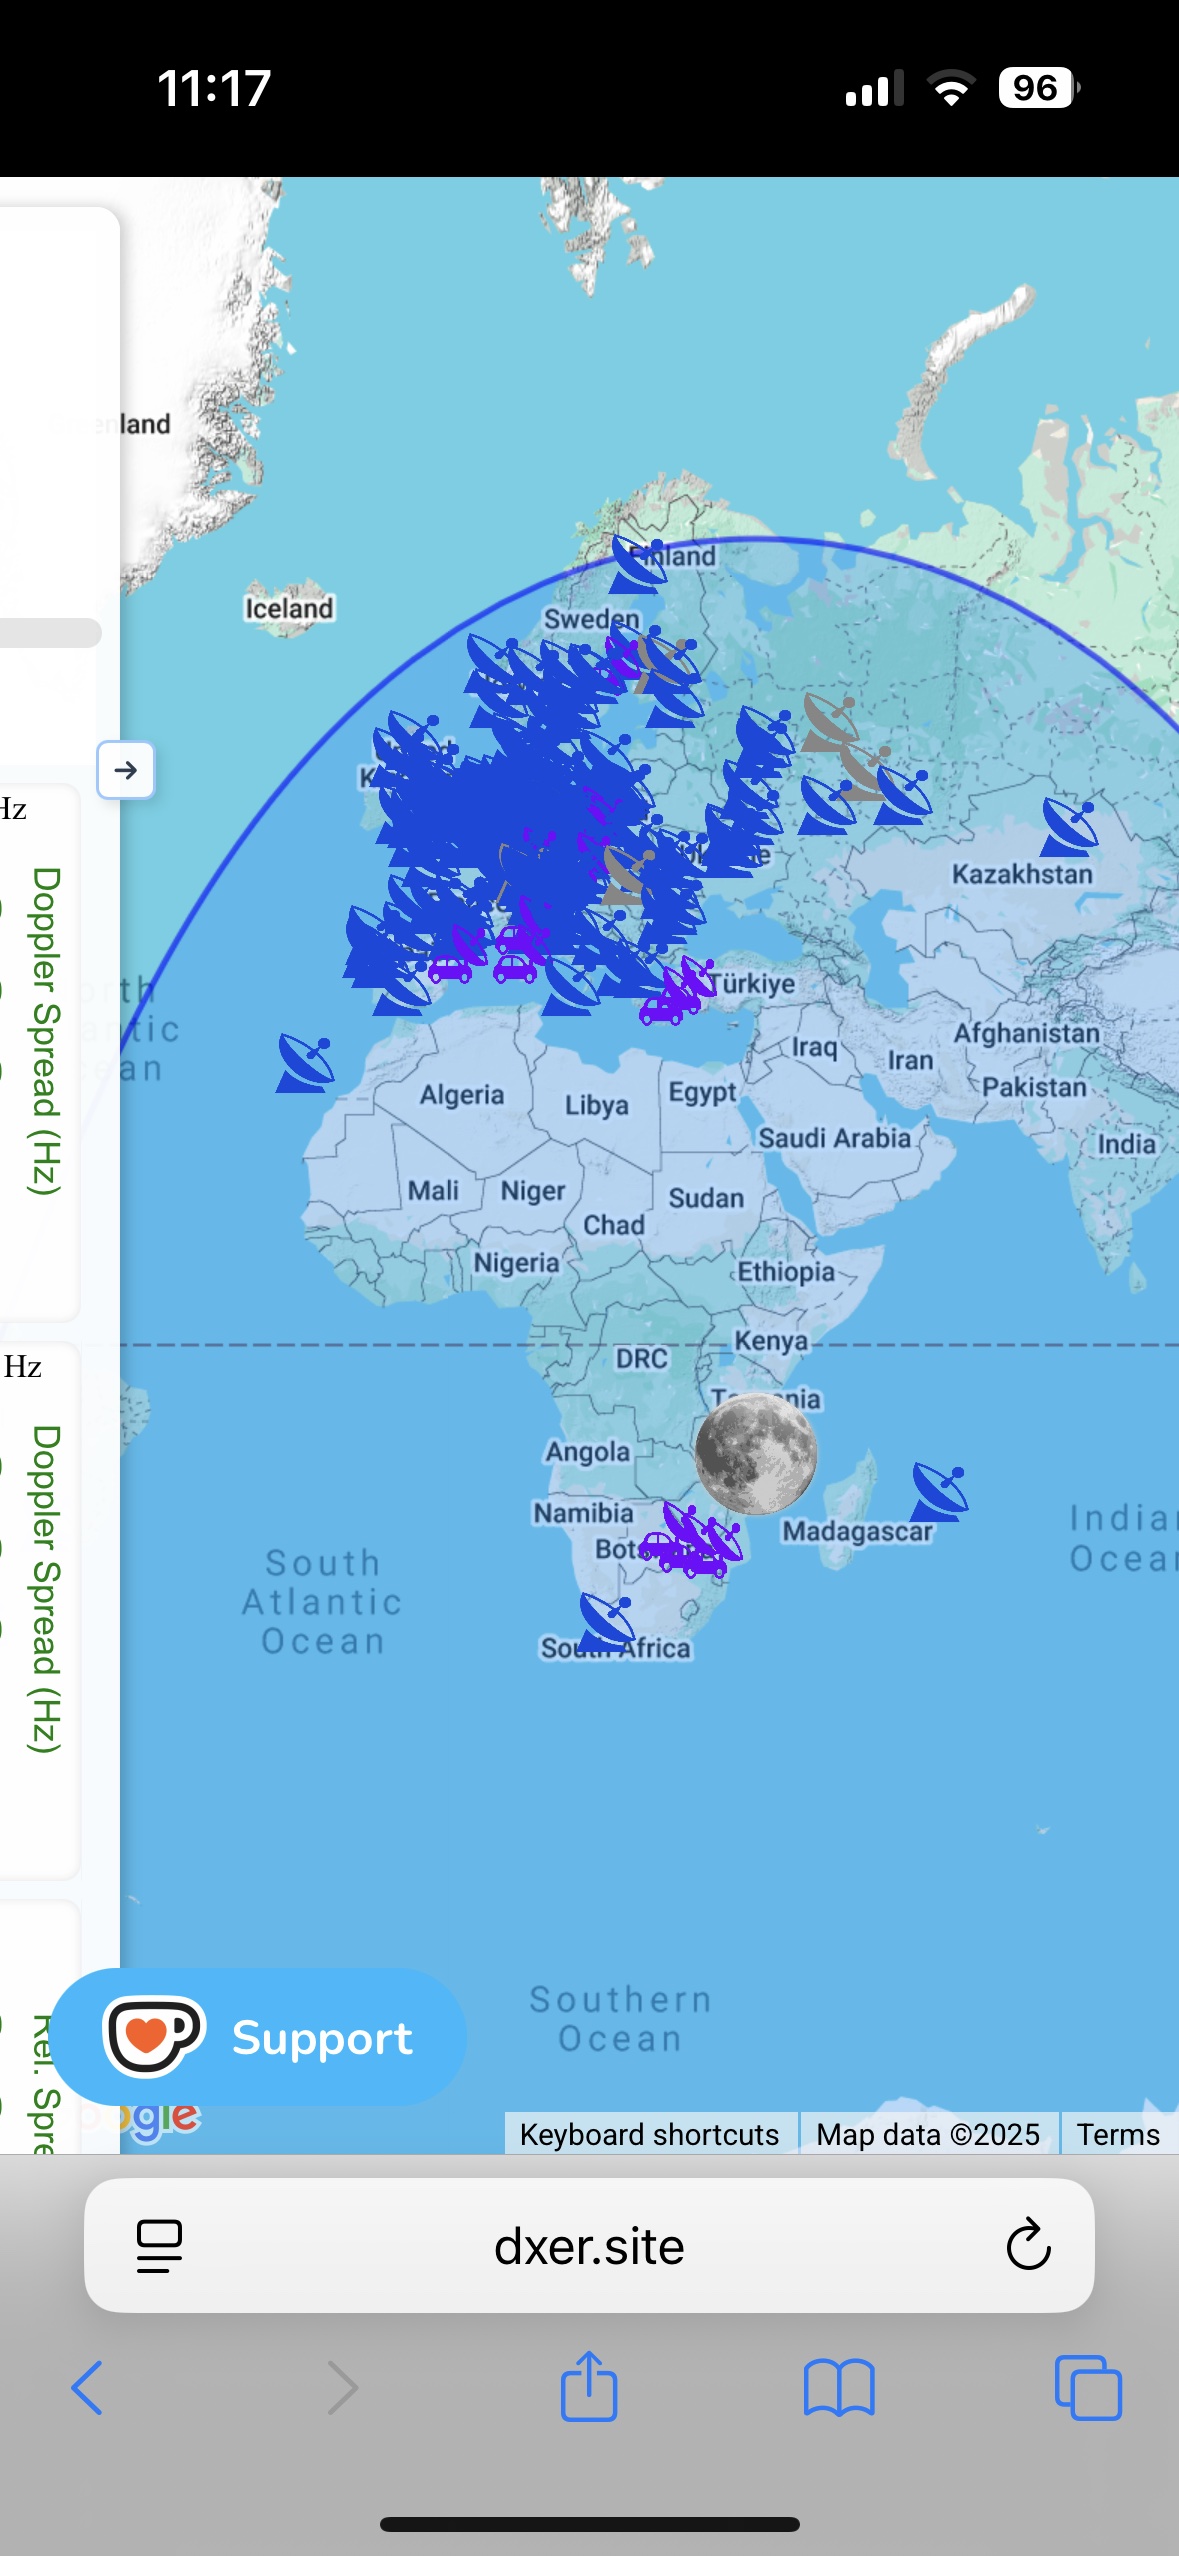
Map View
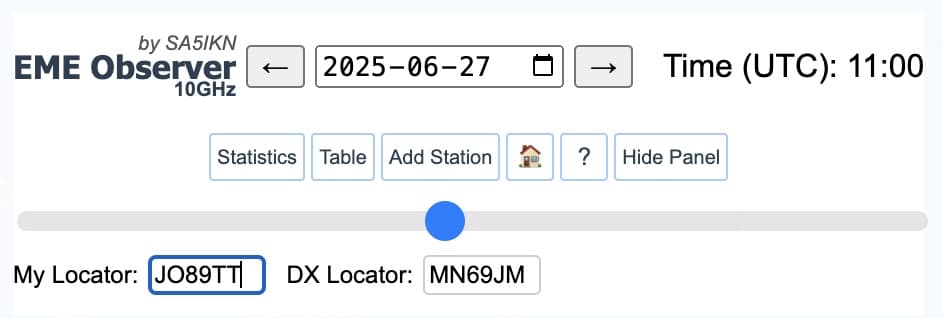
Map View is the default display in EME Observer. When the application loads, the My Locator and DX Locator fields are blank, and the date and time are automatically set to the current UTC time, rounded to the nearest 5 minutes.
You can adjust the date using the date picker or its arrow controls, and change the time by moving the time slider. As you move the slider, the Moon footprint updates in 5-minute increments (or 1-minute steps in the Realtime Tracking mode). The Moon icon marks the sublunar point - the location on Earth where the Moon is directly overhead.
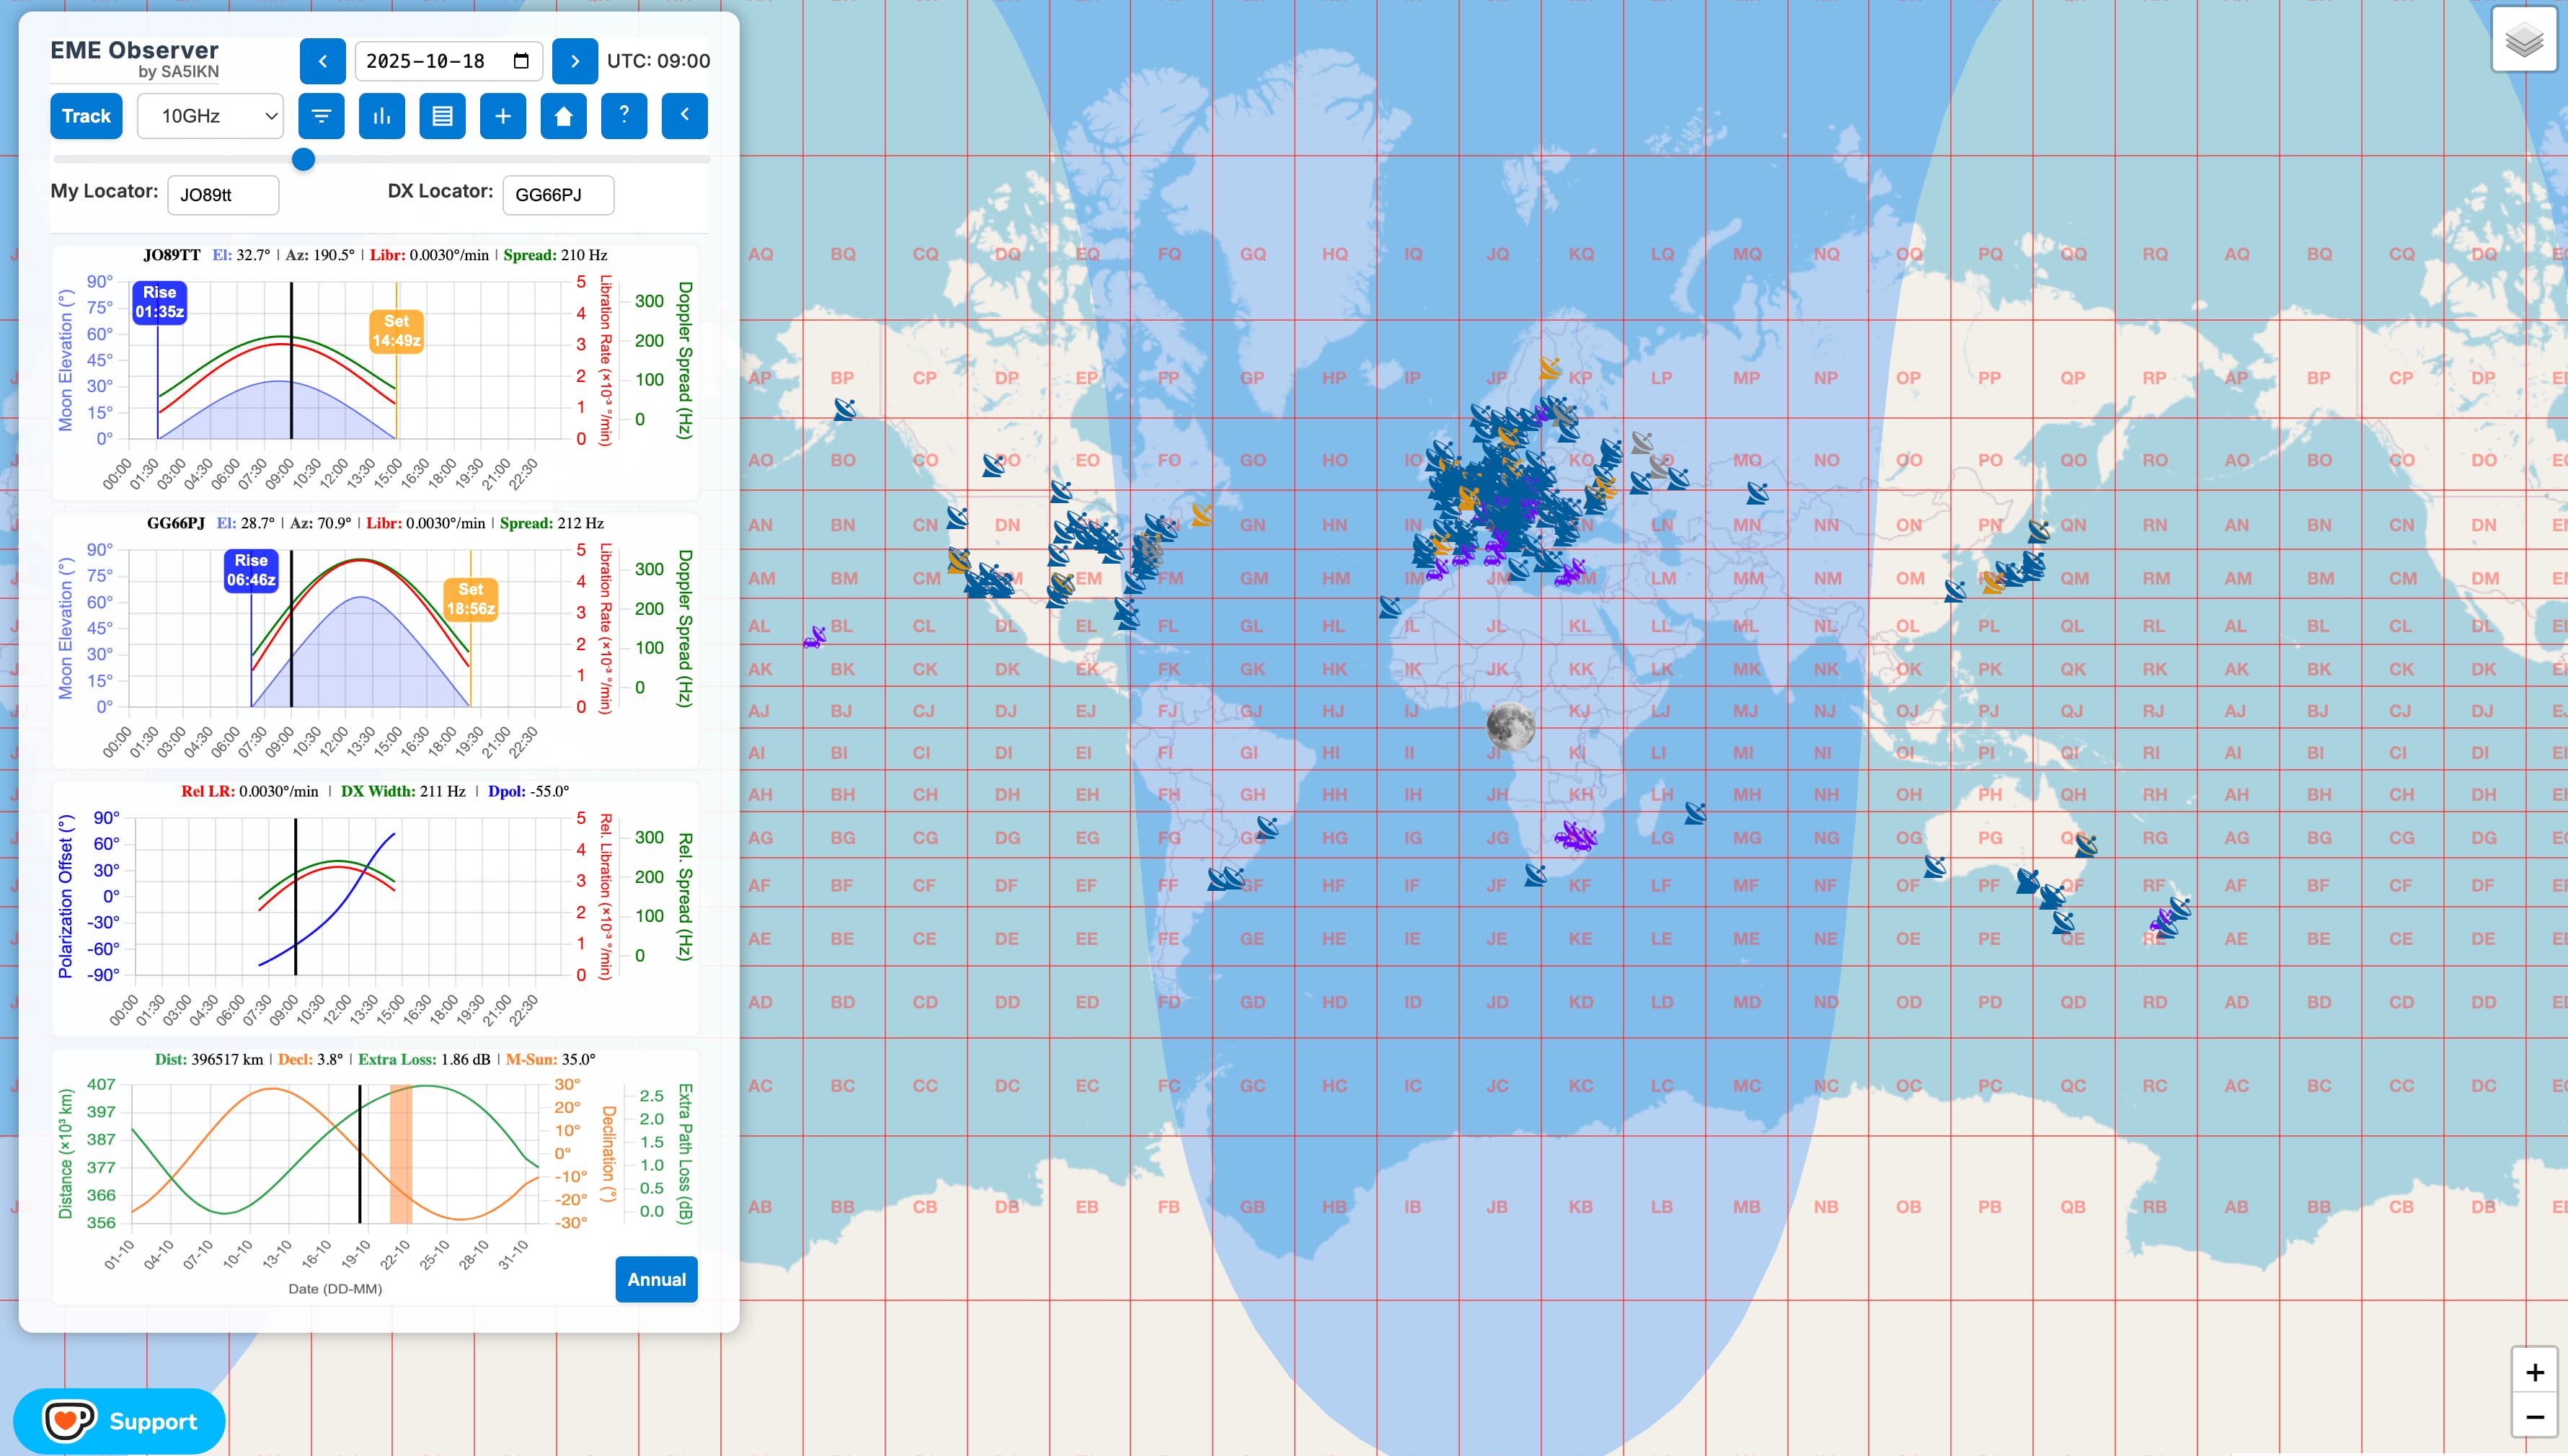
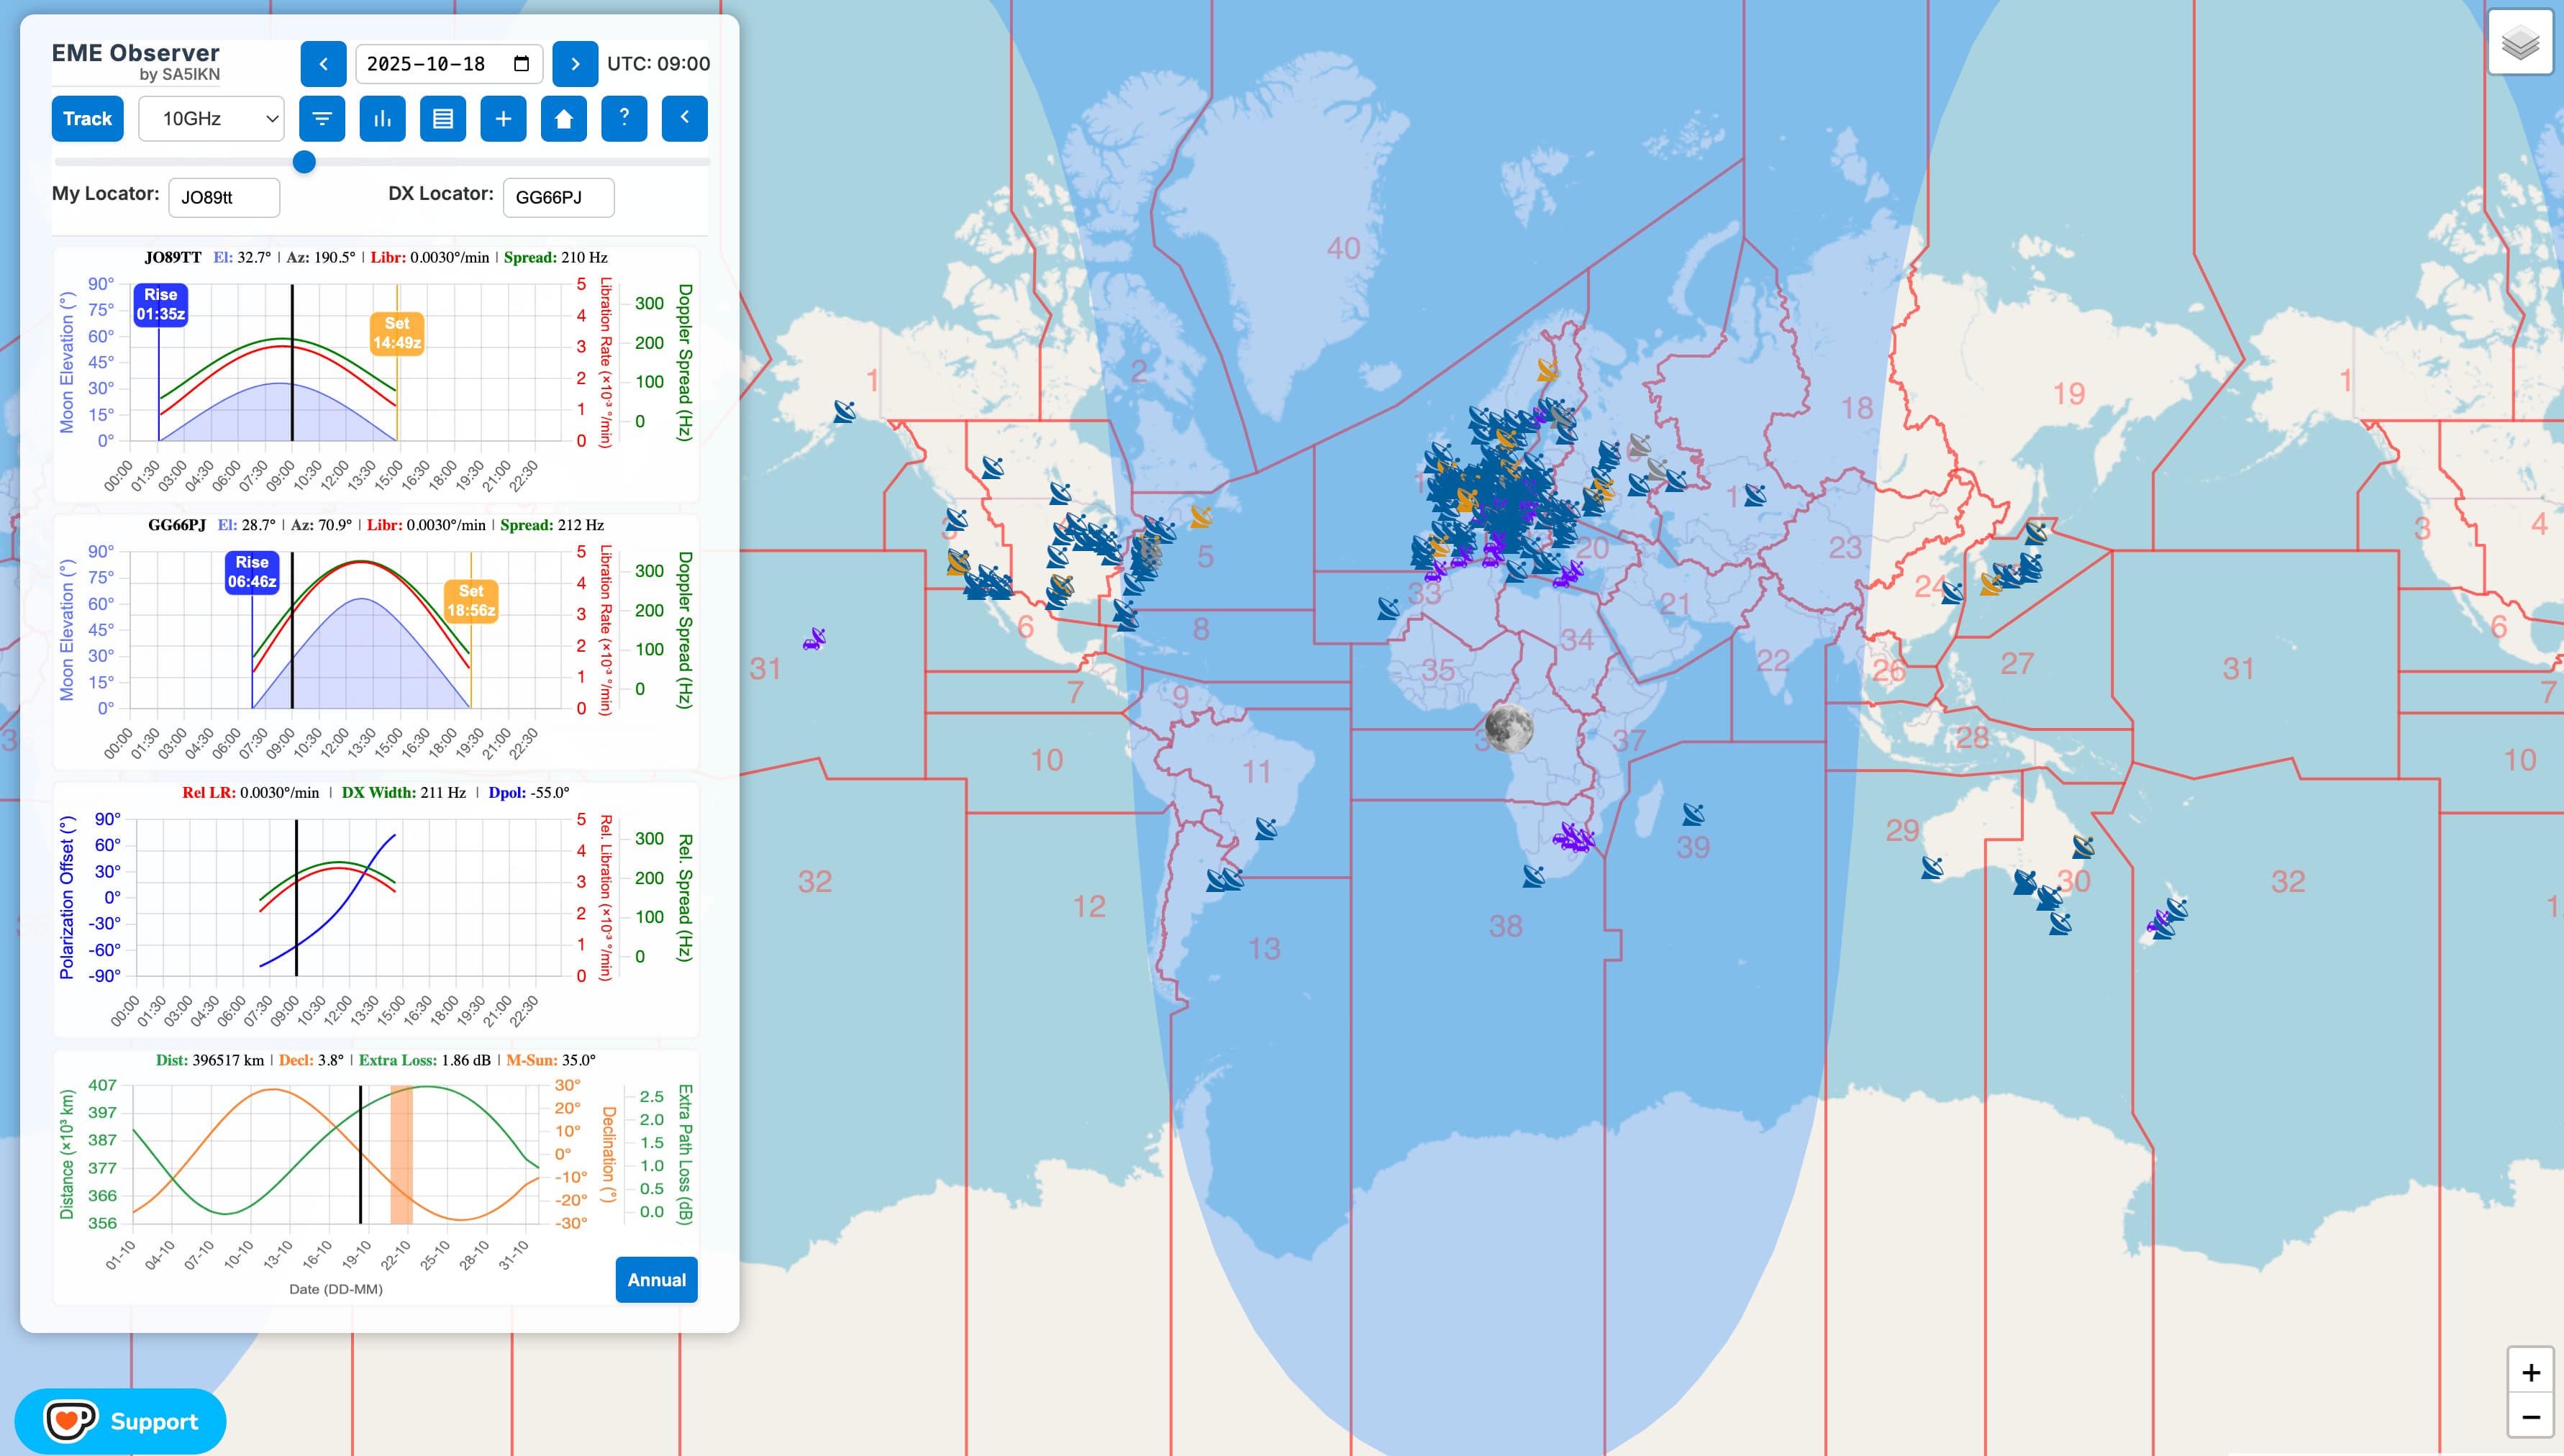
You can enable the realtime mode by pressing the Track button. Additional map layers, QTH locator grids or CQ Zones, can be enabled via the Map Layers icon located in the upper-right corner of the screen.
Control Panel
The Control Panel in EME Observer provides quick access to all essential settings and tools. It includes:
- Time & Date Controls — set the UTC date and time for planning or tracking
- Band Selector — choose the operating band: 144 MHz, 222 MHz, 432 MHz, 902 MHz, 1296 MHz, 2320 MHz, 3400 MHz, 5760 MHz, 10 GHz, 24 GHz, 47 GHz, or 76 GHz
- Mode Selector — toggle between Manual (Planning) mode and Realtime Tracking mode using the “Track” button
- QTH Locator Fields — enter your station grid and the DX station grid
- View Buttons — switch to Table View to browse station records or Statistics View to analyze station and DXCC data
- Quick Links — access the station submission page and this user guide
- Hide Panel Button (←) — collapse the Control Panel and charts for improved map visibility, especially on mobile devices
- “Annual” Button (next to the Moon Data Chart) — open printable annual lunar ephemeris PDFs and an interactive yearly ephemeris overview
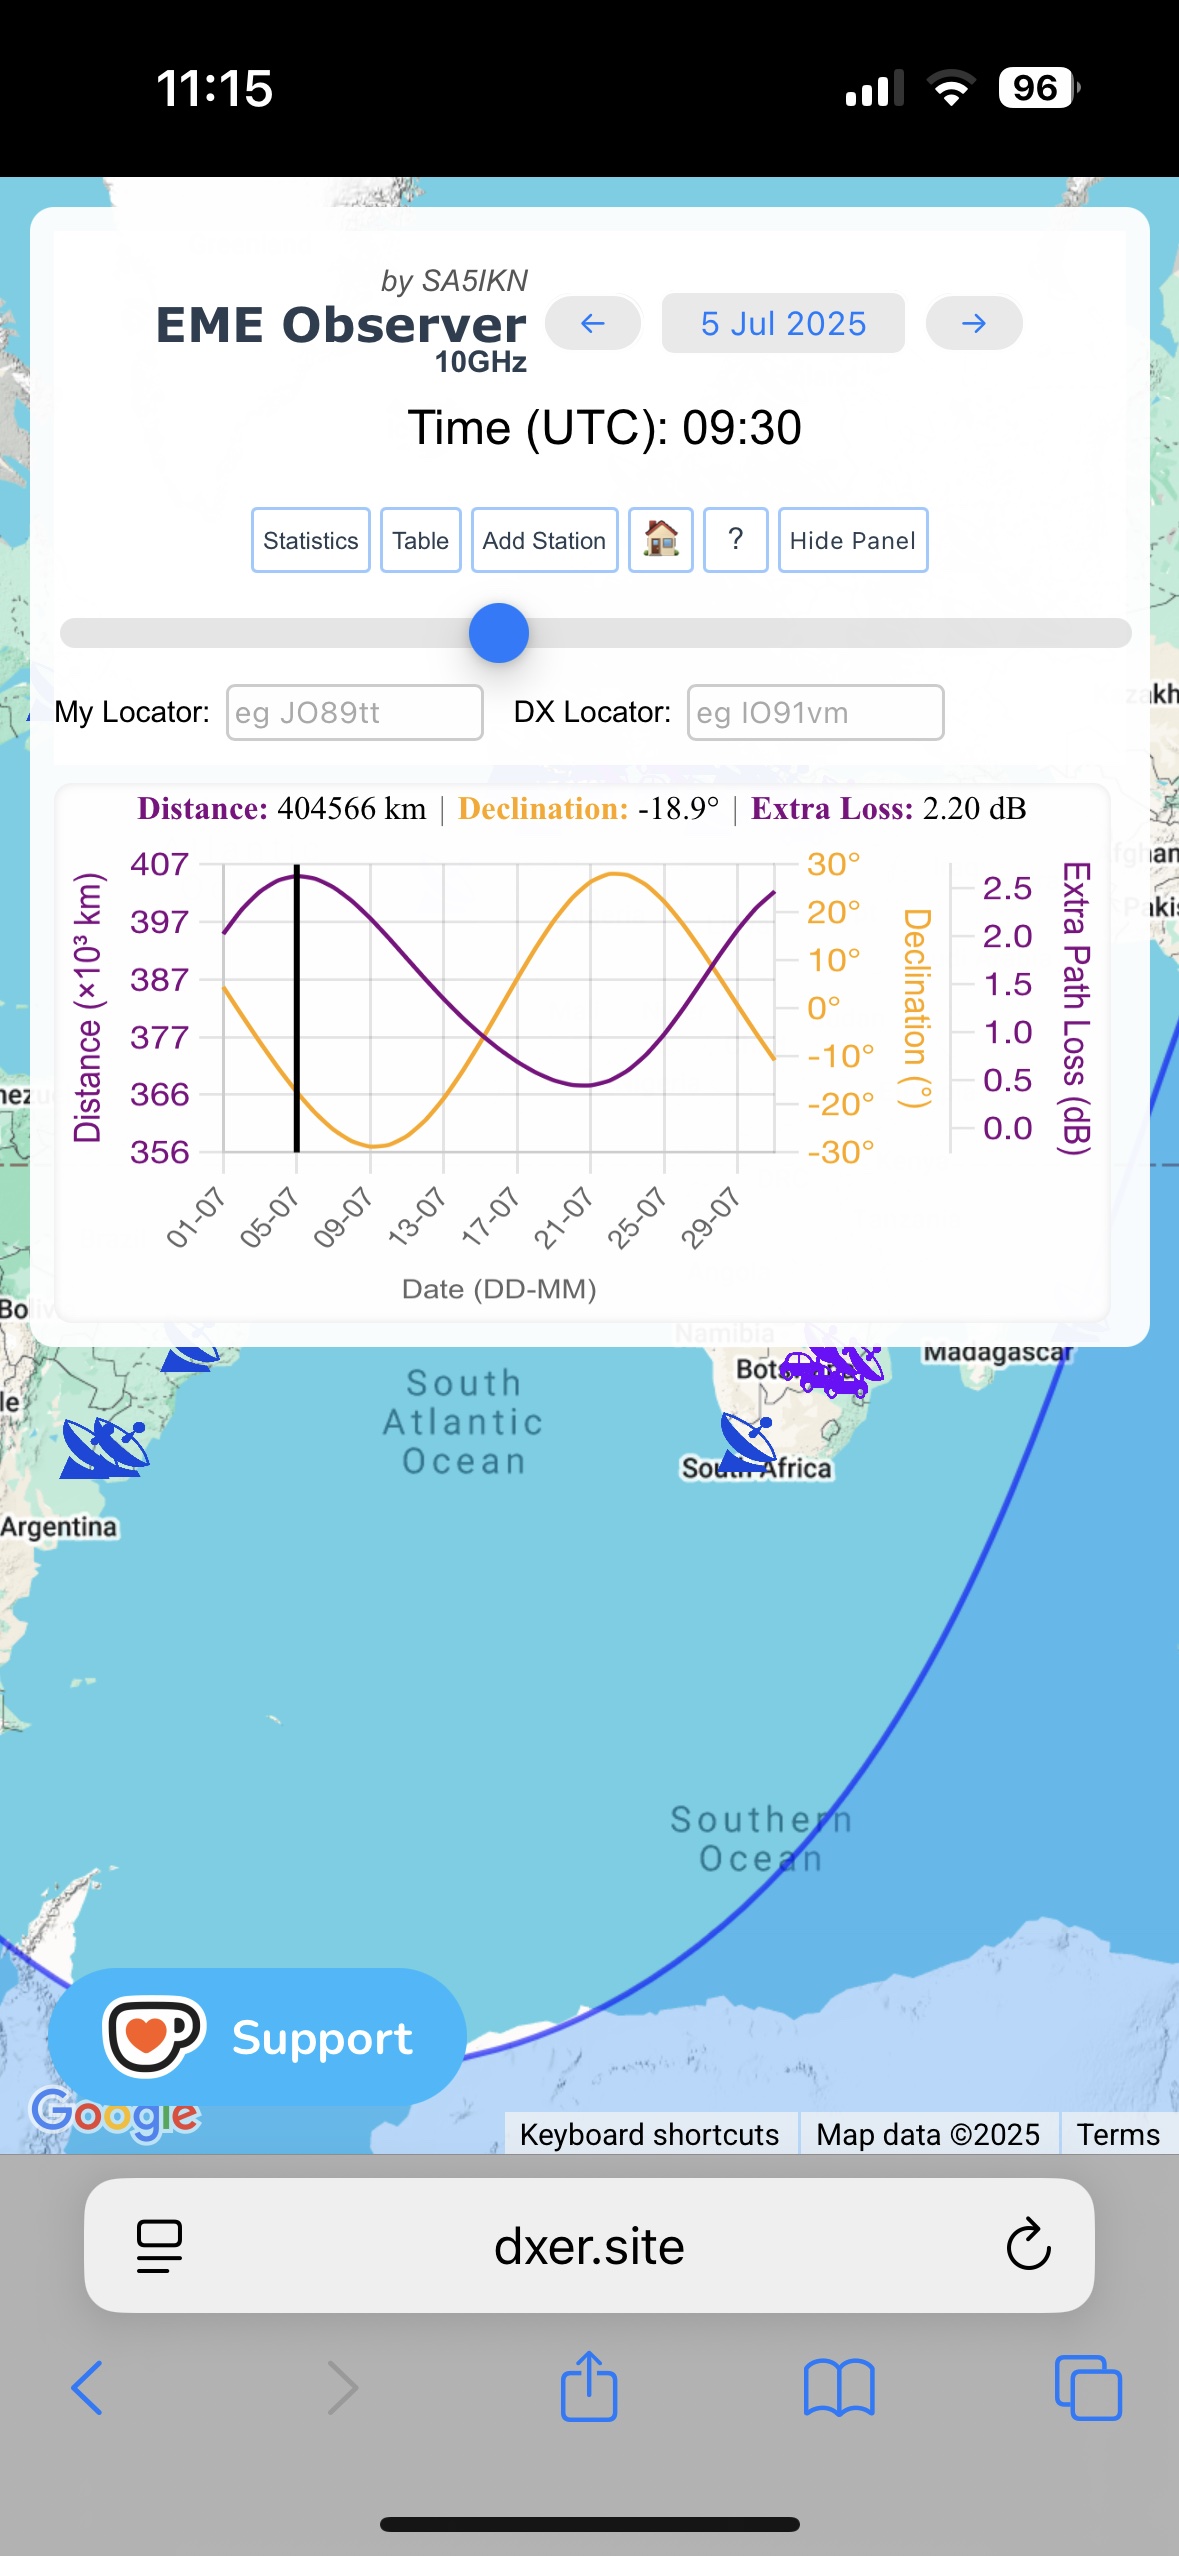
Daily Moon Data Chart
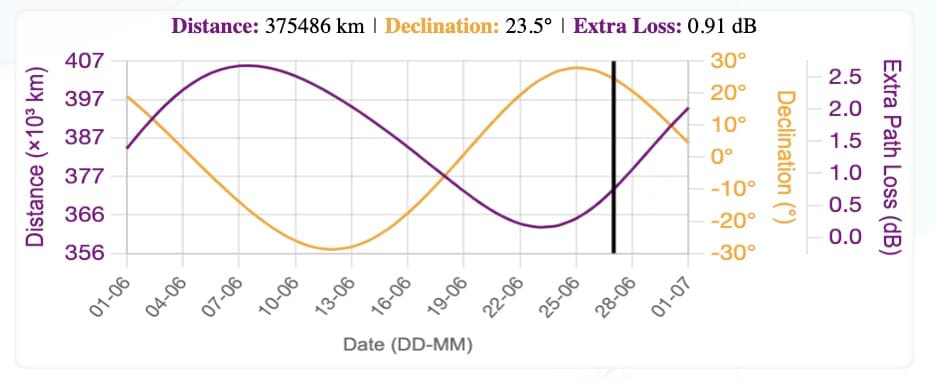
When the page first loads and no QTH locator has been entered by the user, the Moon Data Chart is the only chart displayed. It presents geocentric (Earth-centered) Moon data, which does not depend on any station location. The chart spans a period of one month, with the X-axis representing calendar dates, and displays:
- Moon distance
- Moon declination
- Additional path loss relative to the minimum path loss at perigee
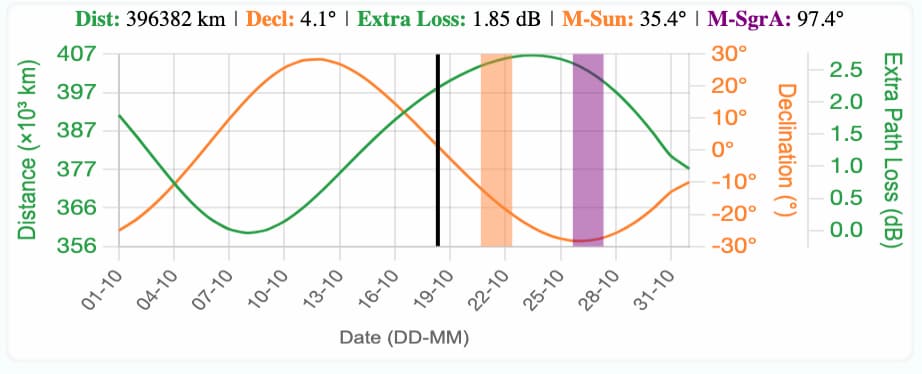
- Moon–Sun angular separation (M-Sun) — the width of the orange marker indicates times when the Moon–Sun separation is below 10 degrees
- Moon–Sagittarius A angular separation (M-SgrA) — for bands below 1 GHz (see bottom screenshot), the width of the violet marker indicates times when the Moon–Sagittarius A separation is below 10 degrees
The vertical black bar on the chart represents the selected date and acts as a time marker. You can adjust the date using the date picker or its arrow controls.
Each curve and its corresponding Y-axis are color-coded, as are the numerical values displayed above the chart for the current Moon distance, declination, and additional path loss. In Manual mode, these values update in 5-minute intervals as you move the time slider, while in Realtime Tracking mode, they automatically update every minute.
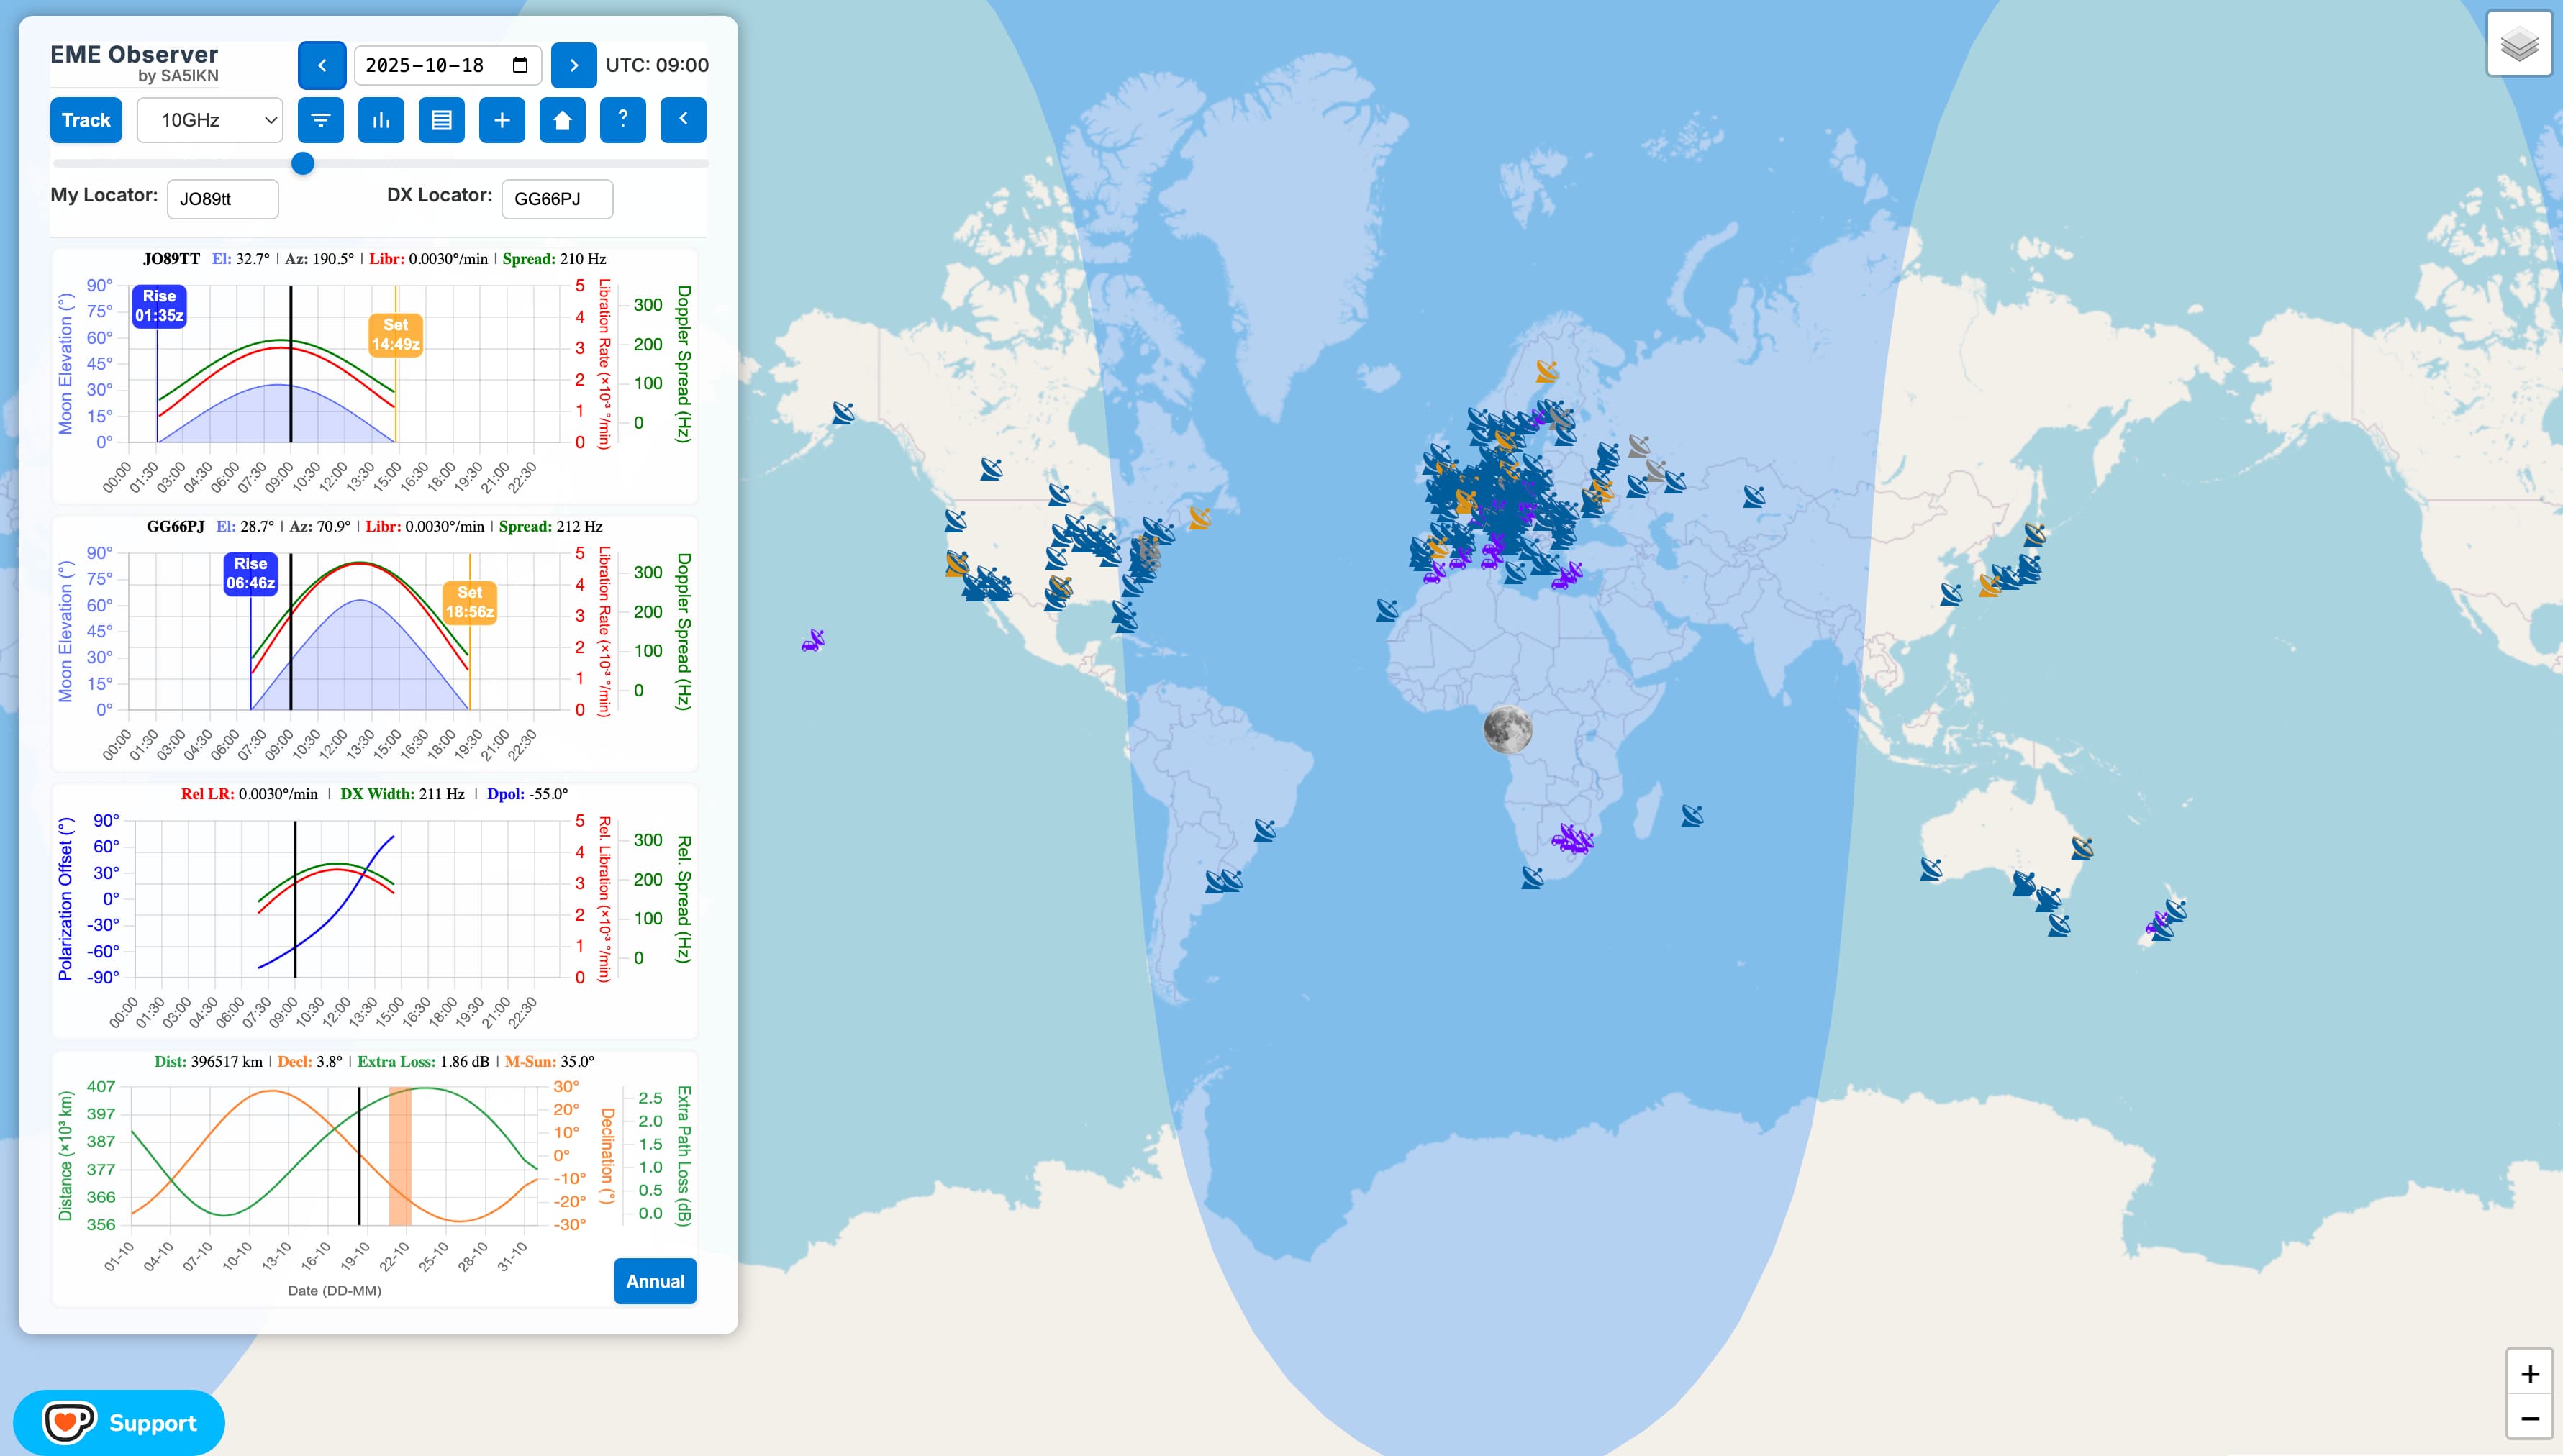
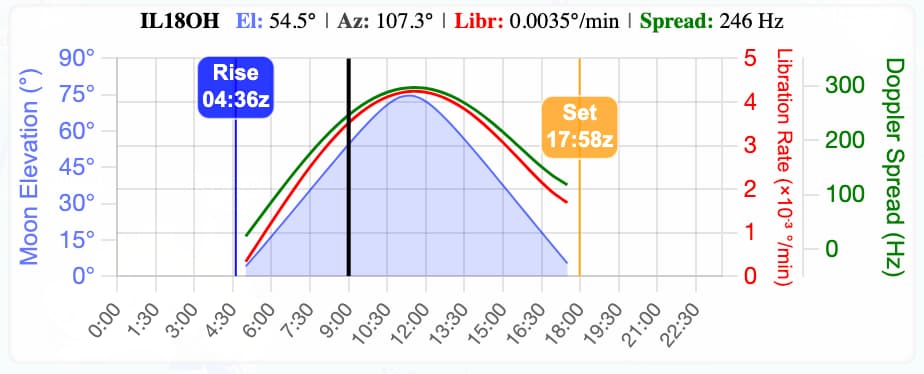
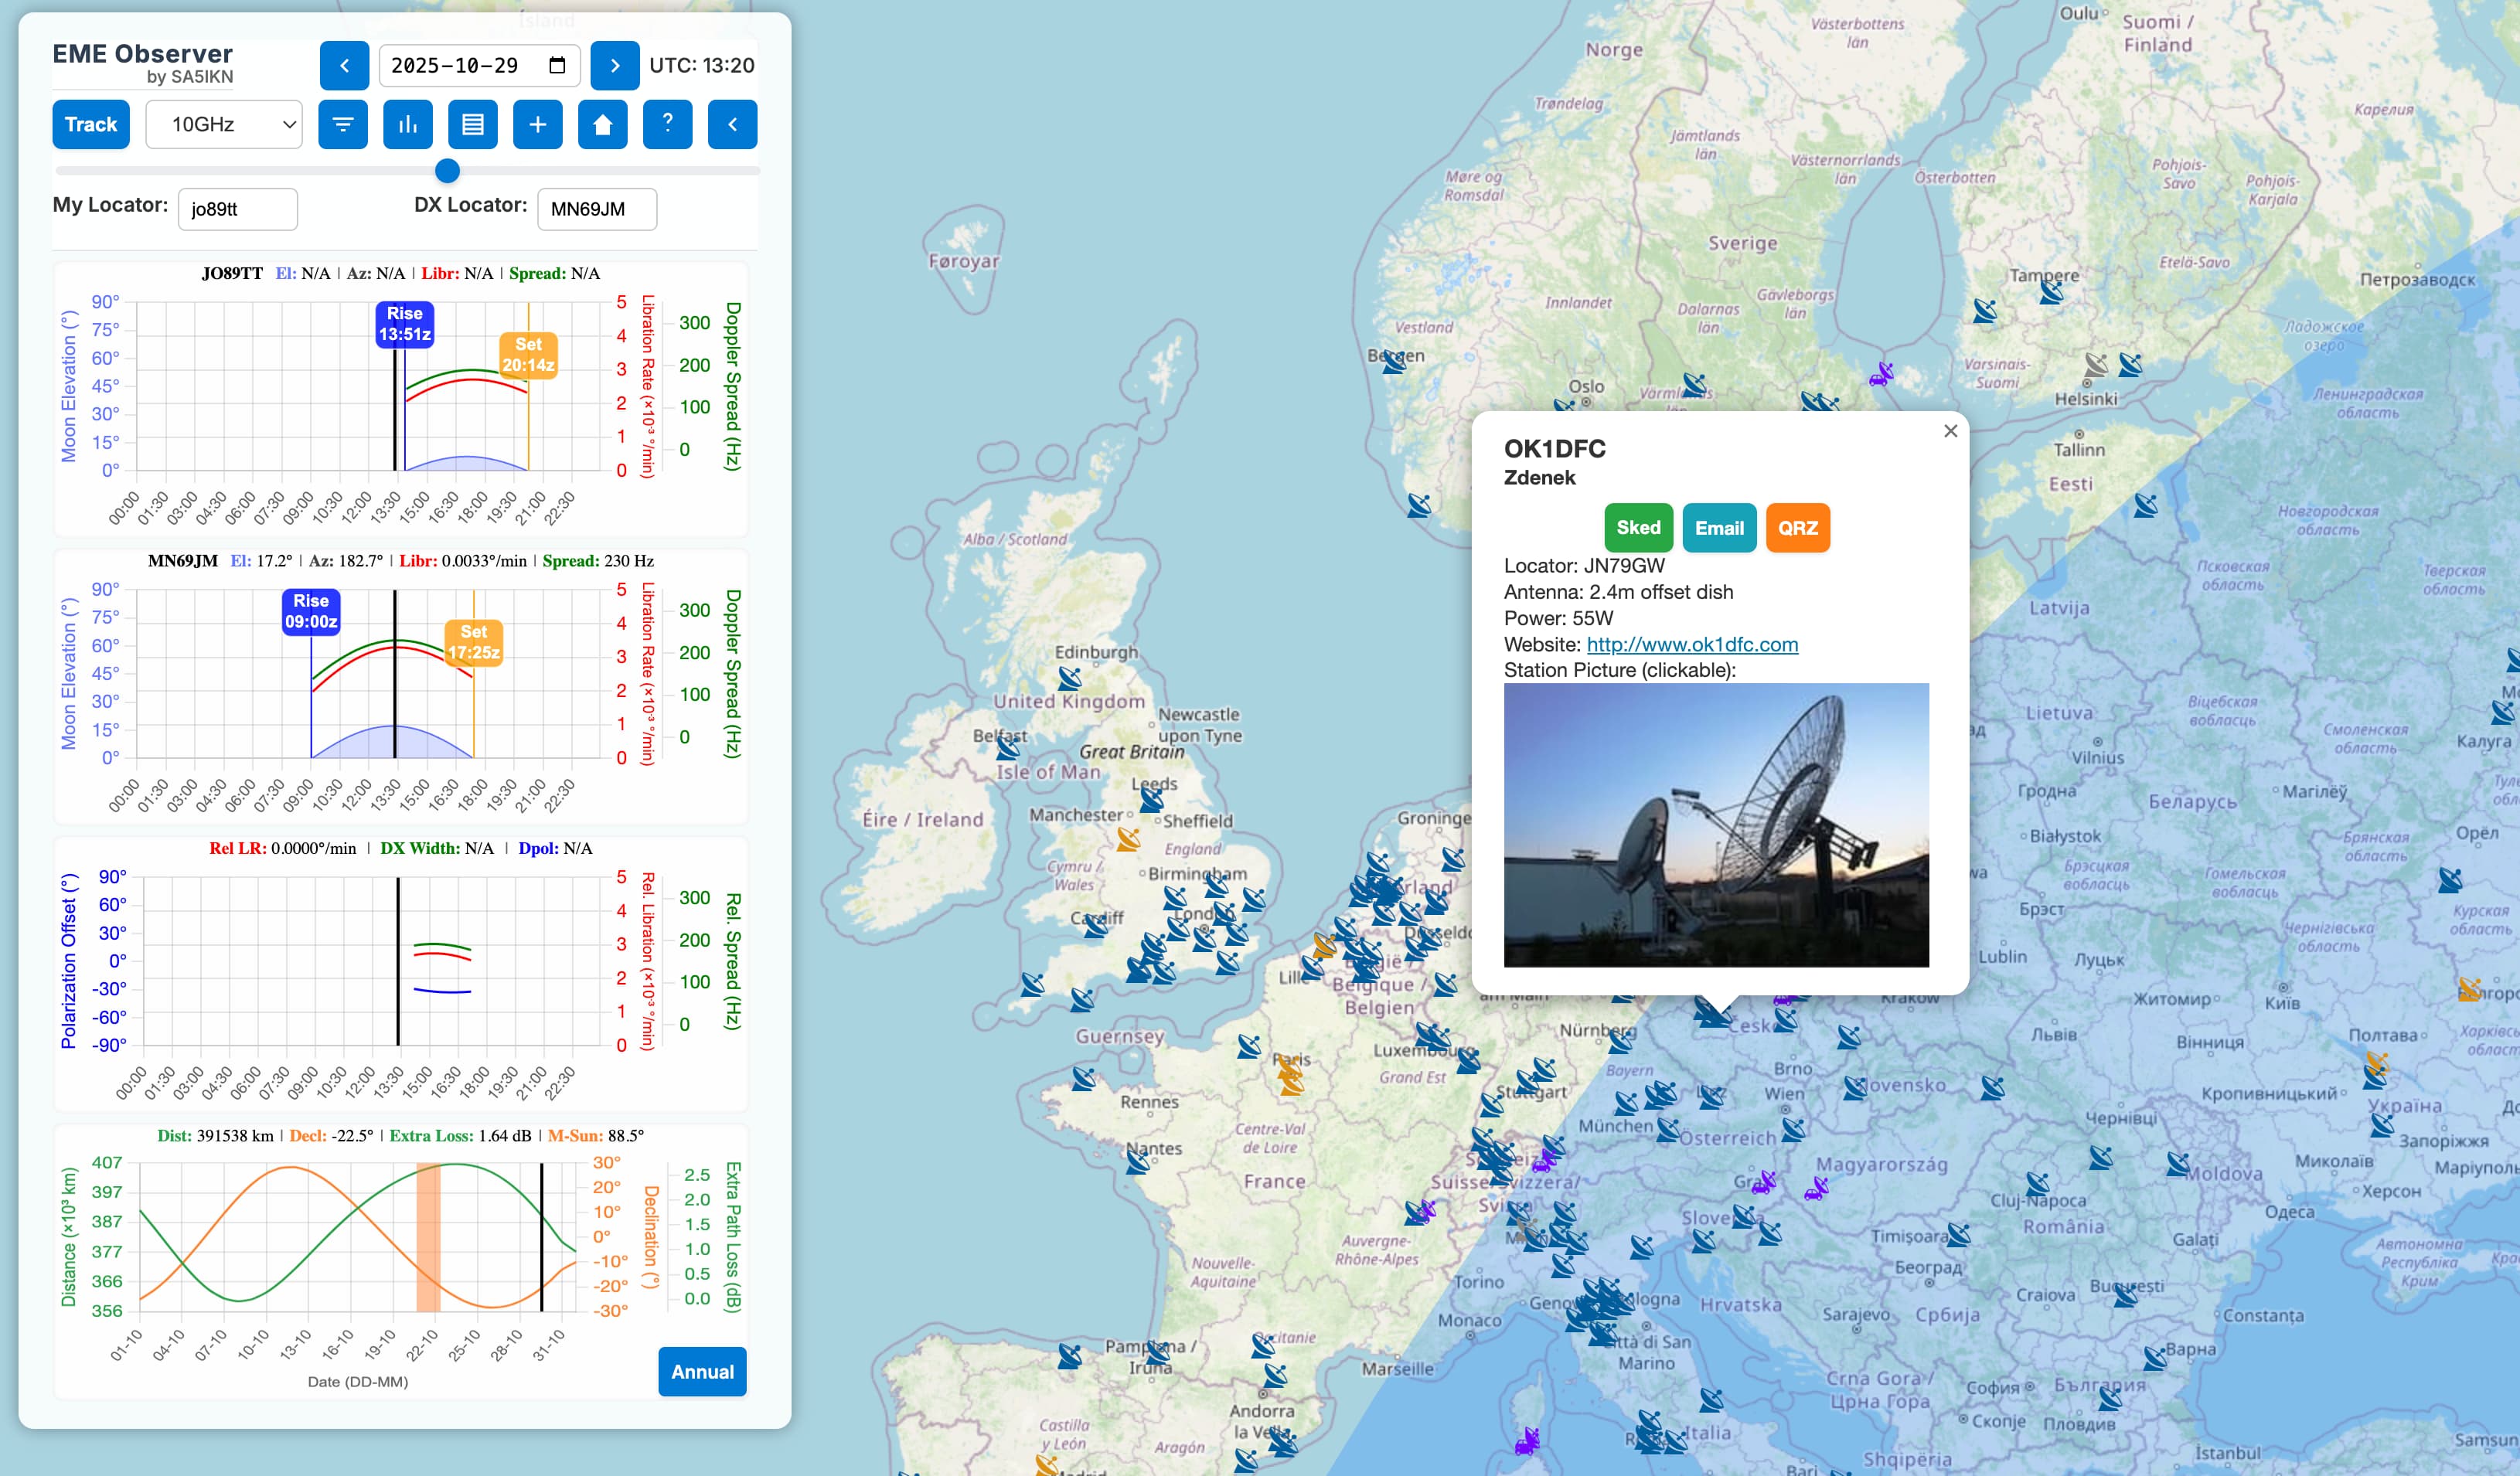
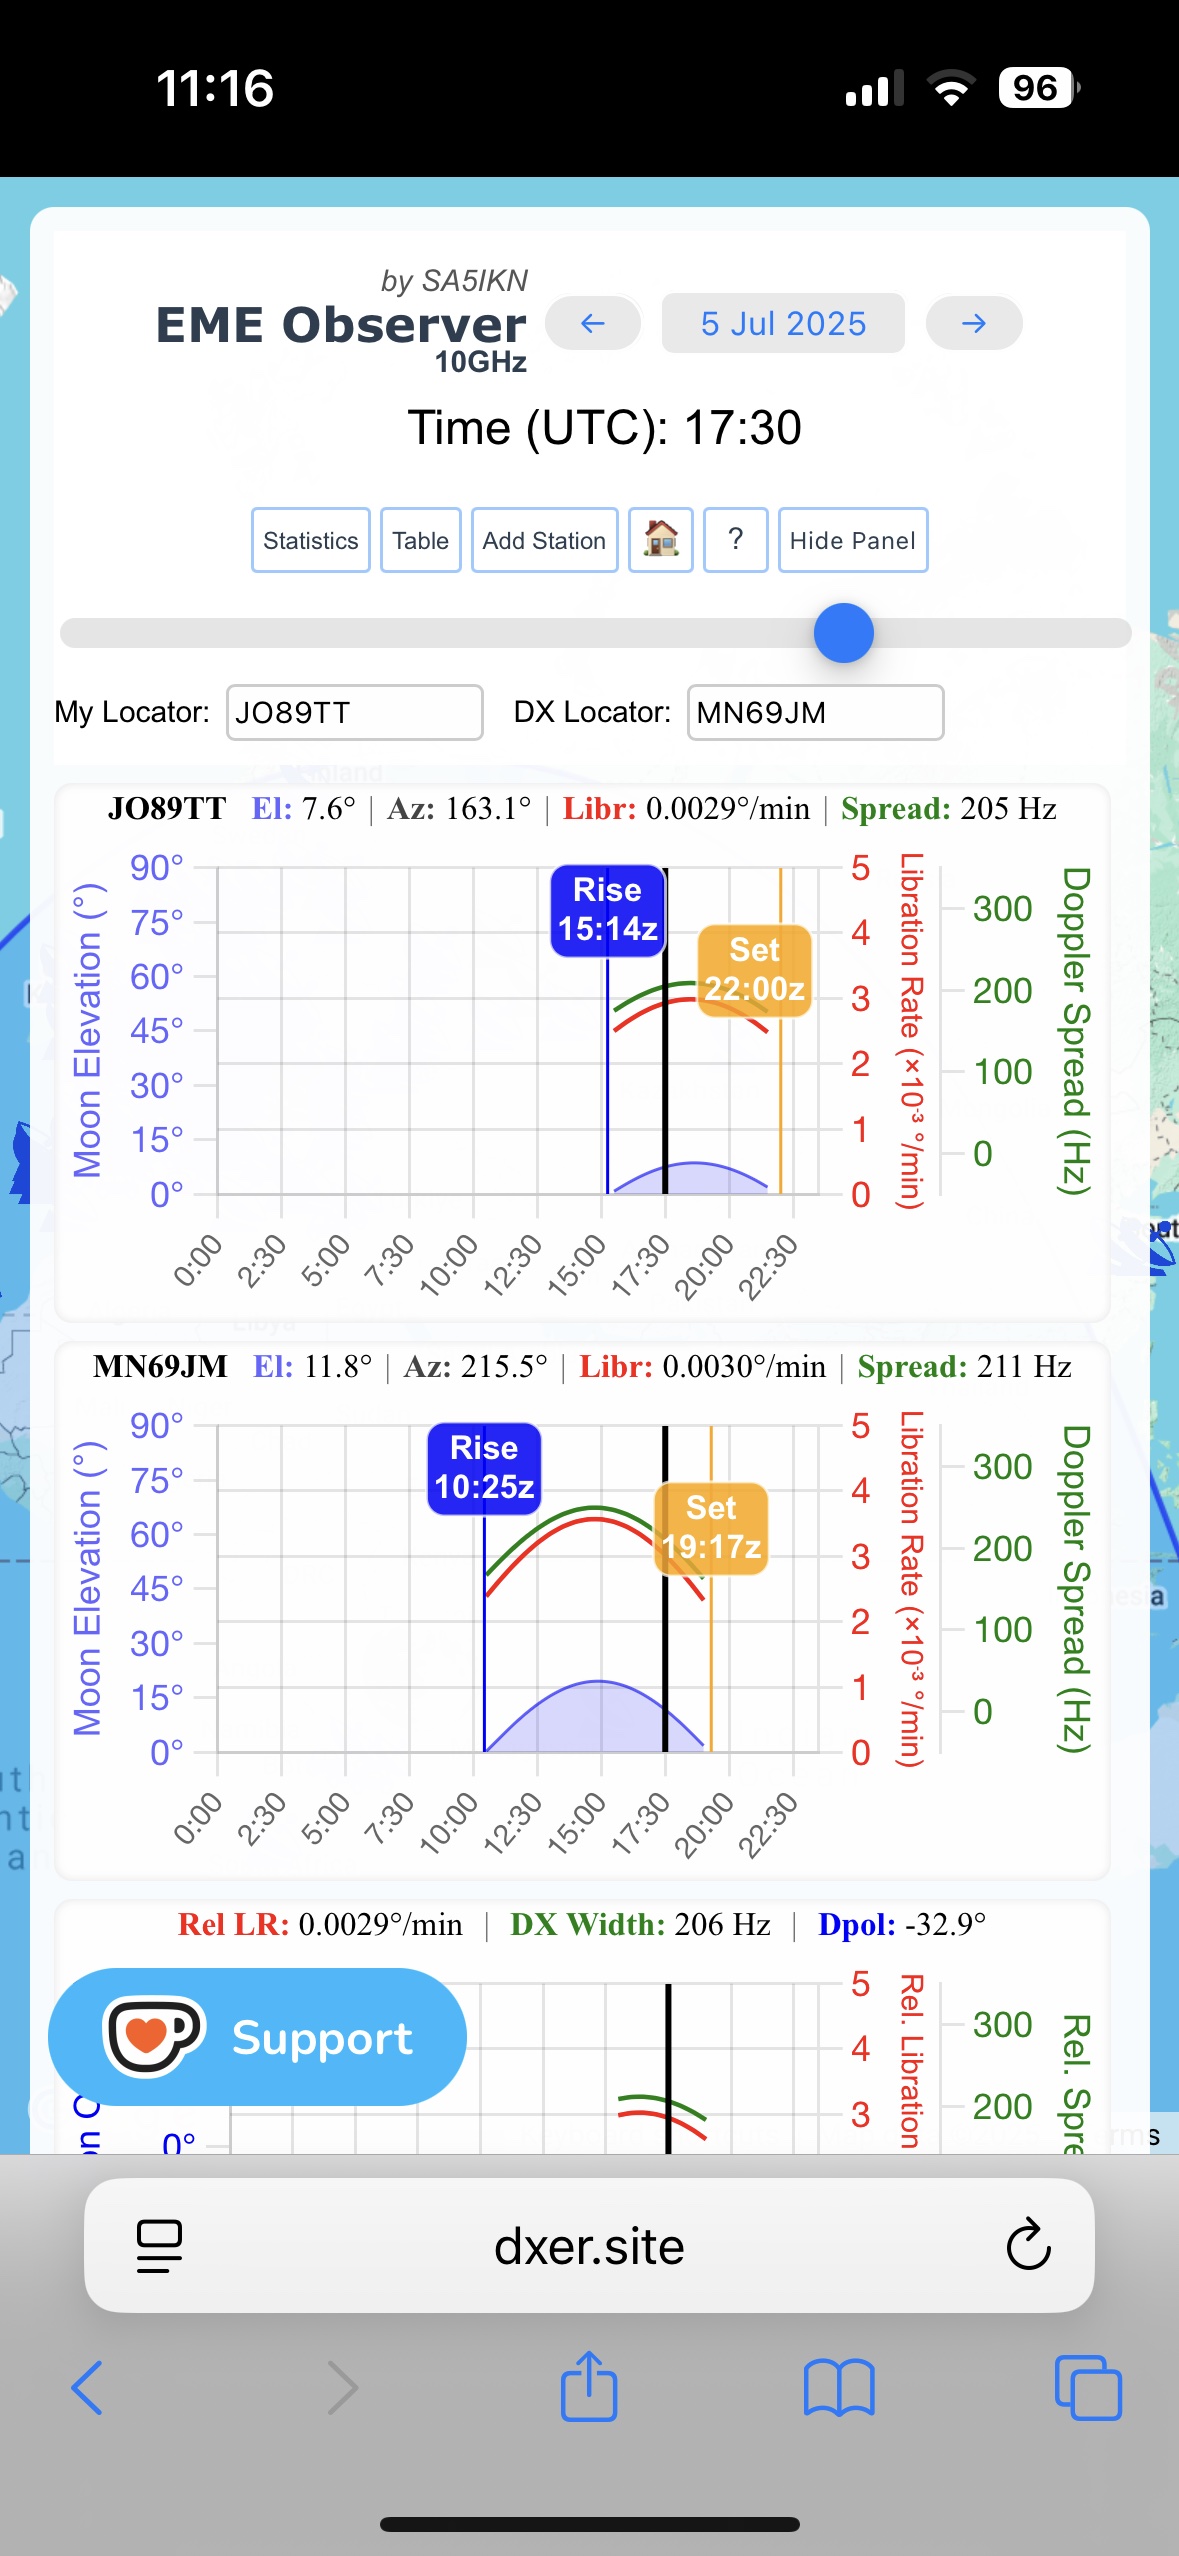
My Location Chart
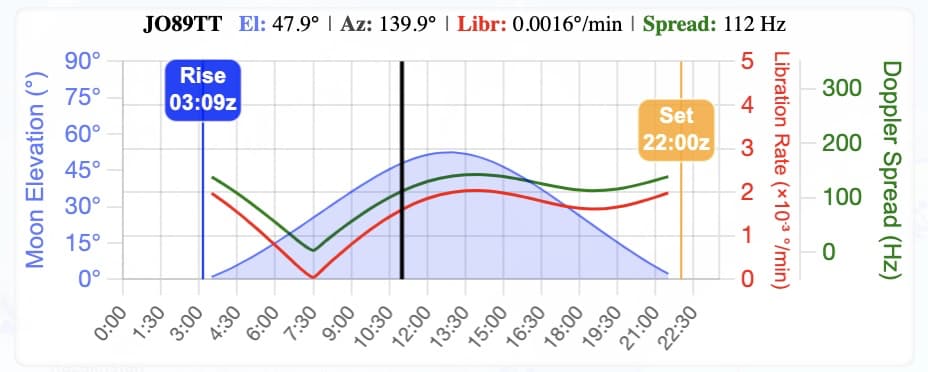
The My Location Chart becomes visible once a valid 6-character QTH locator is entered in the My Locator field. This chart displays topocentric data specific to the user's location:
- Moon elevation (and azimuth, shown above the graph)
- Moonrise and Moonset times
- Topocentric libration rate
- Doppler spread for the selected band (equivalent to “Width” in the Astronomical Data window of WSJT-X)
The X-axis represents time in 5-minute intervals, and the black vertical line serves as a time marker that updates as you move the time slider in Manual mode or automatically in Realtime Tracking mode.
Each curve on the chart is color-coded to match its corresponding Y-axis. The current values for Moon elevation, azimuth, libration rate, and full limb-to-limb Doppler spread are displayed above the chart in matching colors for quick reference.
DX Location Chart
The DX Location Chart appears when a valid 6-character QTH locator is entered for the DX station. It shares the same layout and visual style as the My Location chart.
When both charts are visible, you can compare Moon visibility for your own station and the DX station, helping identify overlapping Moon windows for potential QSOs. The DX locator can be entered manually or automatically by clicking a station marker on the map and selecting the green Sked button next to the station’s locator.
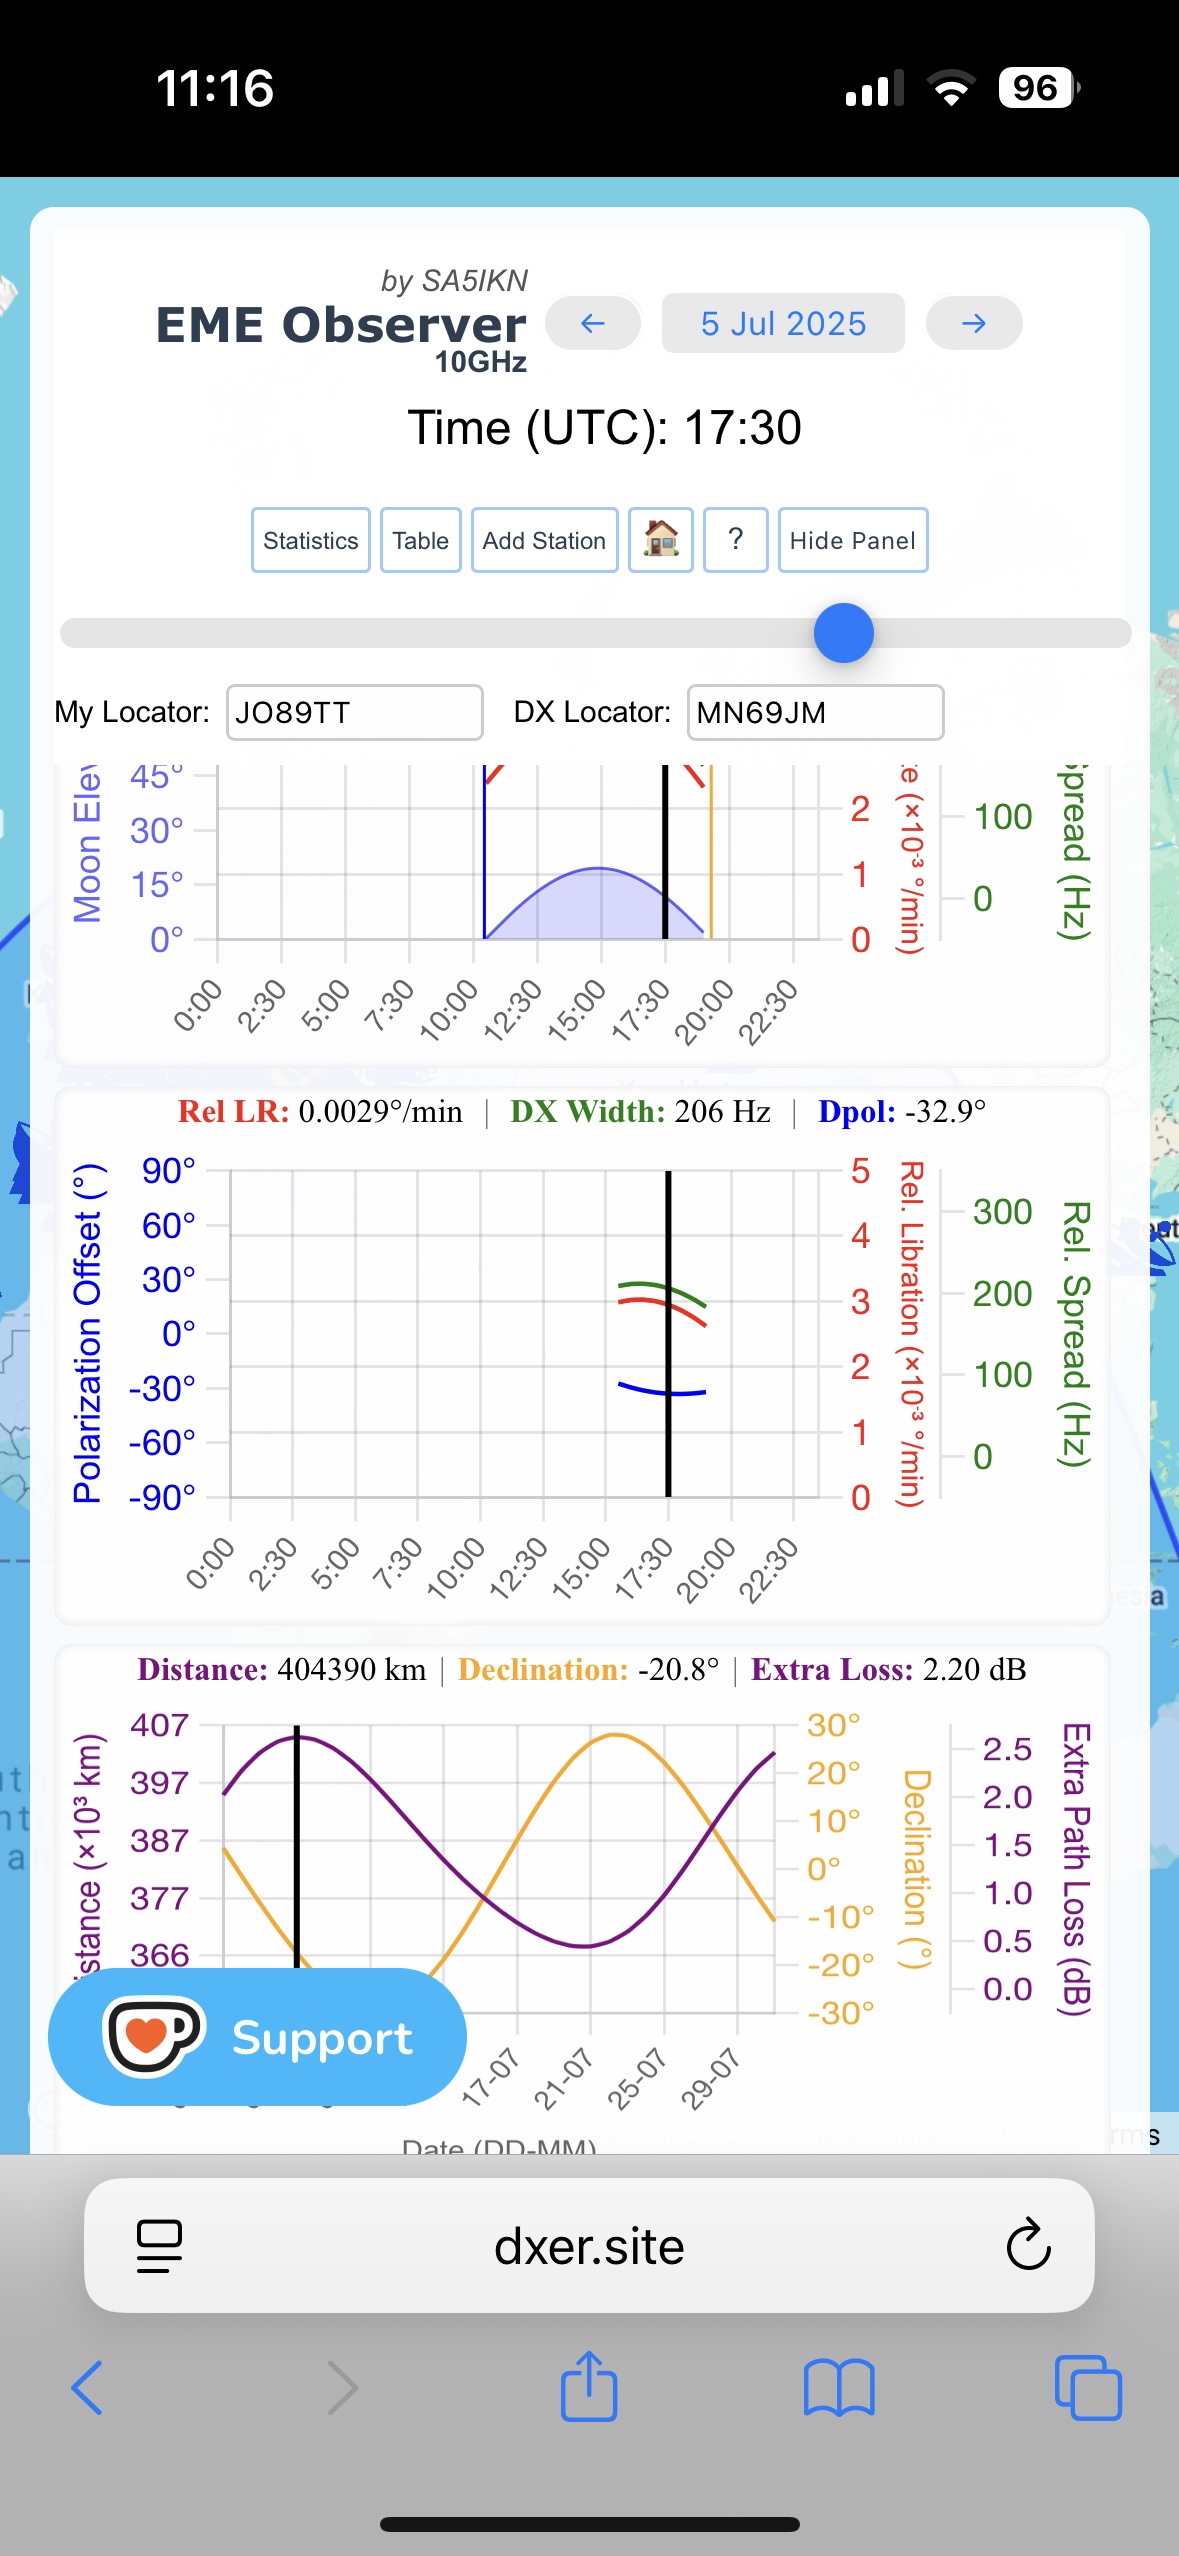
Sked Chart
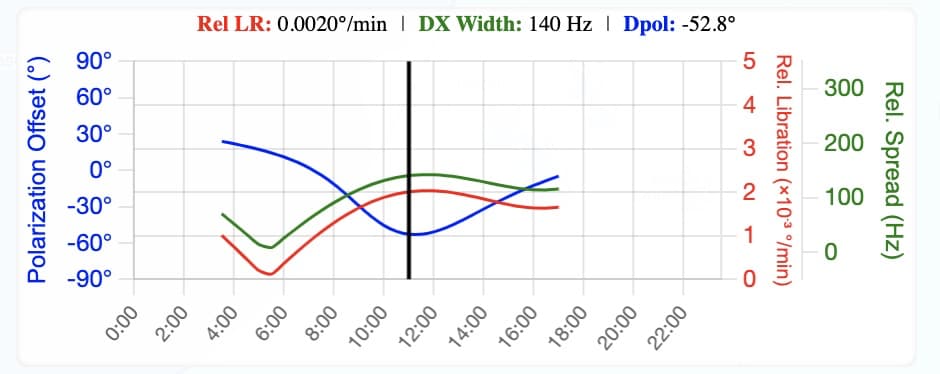
The Sked Chart becomes visible when valid 6-character QTH locators are entered in both the My Locator and DX Locator fields, and a common moon window exists between them on the selected date. The chart displays key signal-path metrics (computed as vectors) within these common moon windows: Relative Libration Rate (Rel LR), Relative Doppler Spread for the selected band (DX Width), and Spatial Polarization Offset (Dpol).
The beginning and end of each common window are marked by green and red vertical lines, respectively. The corresponding start and end times appear in matching colors next to these markers. There may be one, two, or three common windows within a 24-hour period. If no common moon window exists, the Sked Chart is not displayed.
As with the other charts, each curve and its associated Y-axis are color-coded, as are the numerical values shown above the chart. The displayed parameters are defined as follows:
- Dpol (blue) – Spatial polarization offset in degrees (equivalent to Dpol in WSJT-X)
- Rel LR (red) – Relative libration rate between the two stations
- DX Width (green) – Relative Doppler spread for the selected band (equivalent to DXWid in WSJT-X)
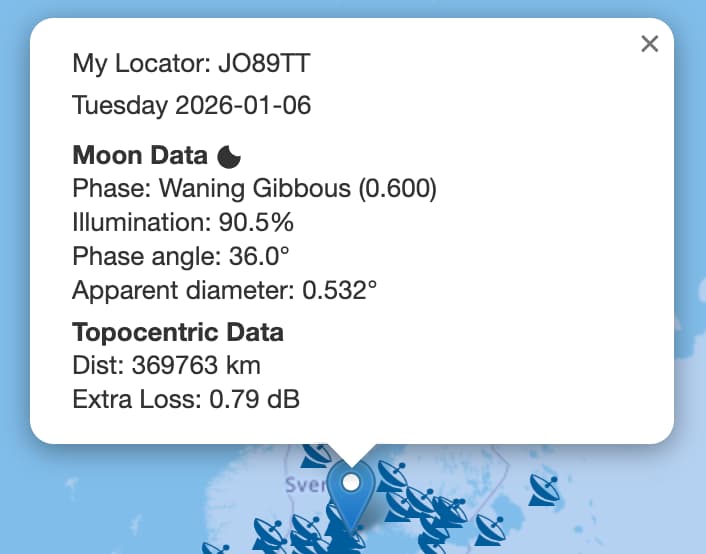
Locator Markers
When a valid 6-character QTH locator is entered in the My Locator field, a marker showing your station’s location is displayed on the map. Clicking this marker opens a tooltip containing general lunar data and topocentric (station-specific) moon data, including:
- Moon phase — the named lunar phase (e.g., New Moon, First Quarter, Full Moon), along with the corresponding phase value
- Lunar disk illumination — the percentage of the Moon’s visible disk that is illuminated
- Phase angle — the Sun–Moon–Earth phase angle in degrees
- Moon apparent diameter — the Moon’s apparent angular diameter as seen from Earth, in degrees
- Topocentric distance — the distance between the observer’s station location and the Moon, accounting for the observer’s position on Earth
- Extra loss due to topocentric distance from the Moon — additional two-way free-space path loss, in dB, relative to the minimum possible distance between the Moon and the observer on Earth.
Entering a valid 6-character QTH locator in the DX Locator field adds a second marker identifying the DX station’s location.
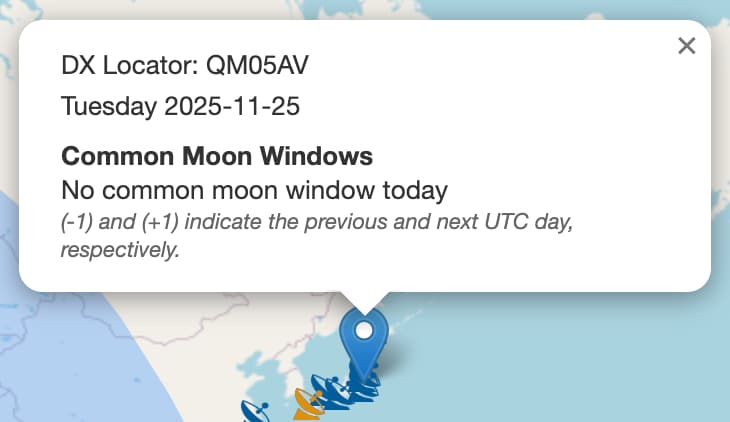
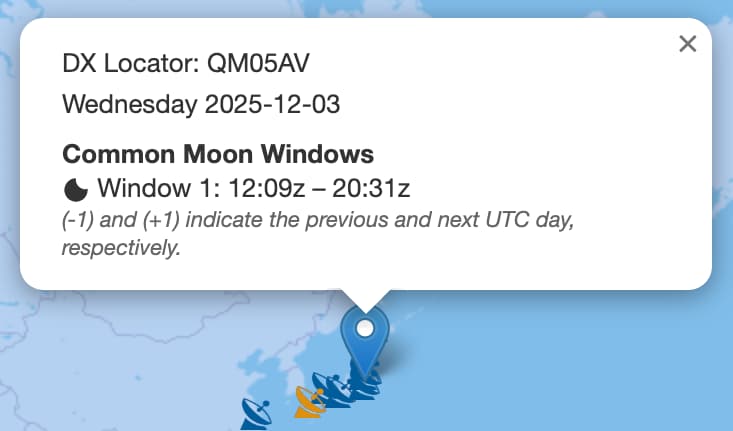

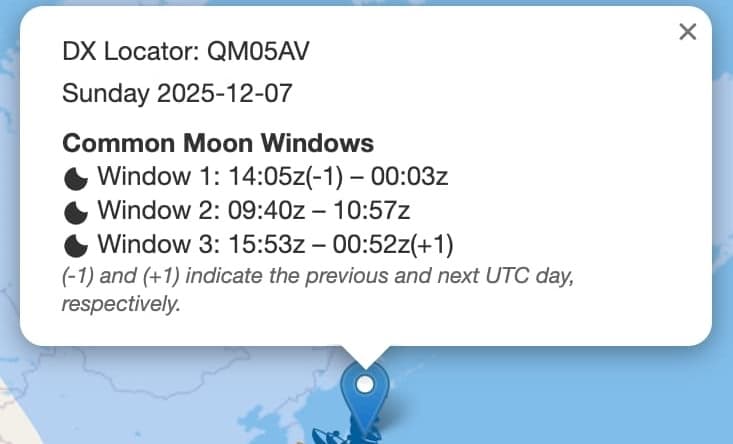
Clicking the DX location marker opens an information window showing the DX locator, the selected day and date, and any common moon windows between the two QTH locators. If no common moon window exists for the selected date, the message No common moon window today is displayed.
Up to three common moon windows may occur within a 24-hour period, depending on the date. All times are given in UTC. Because a moon window may cross midnight, the notation (-1) and (+1) is used to indicate that the time corresponds to the previous or next UTC day, respectively.
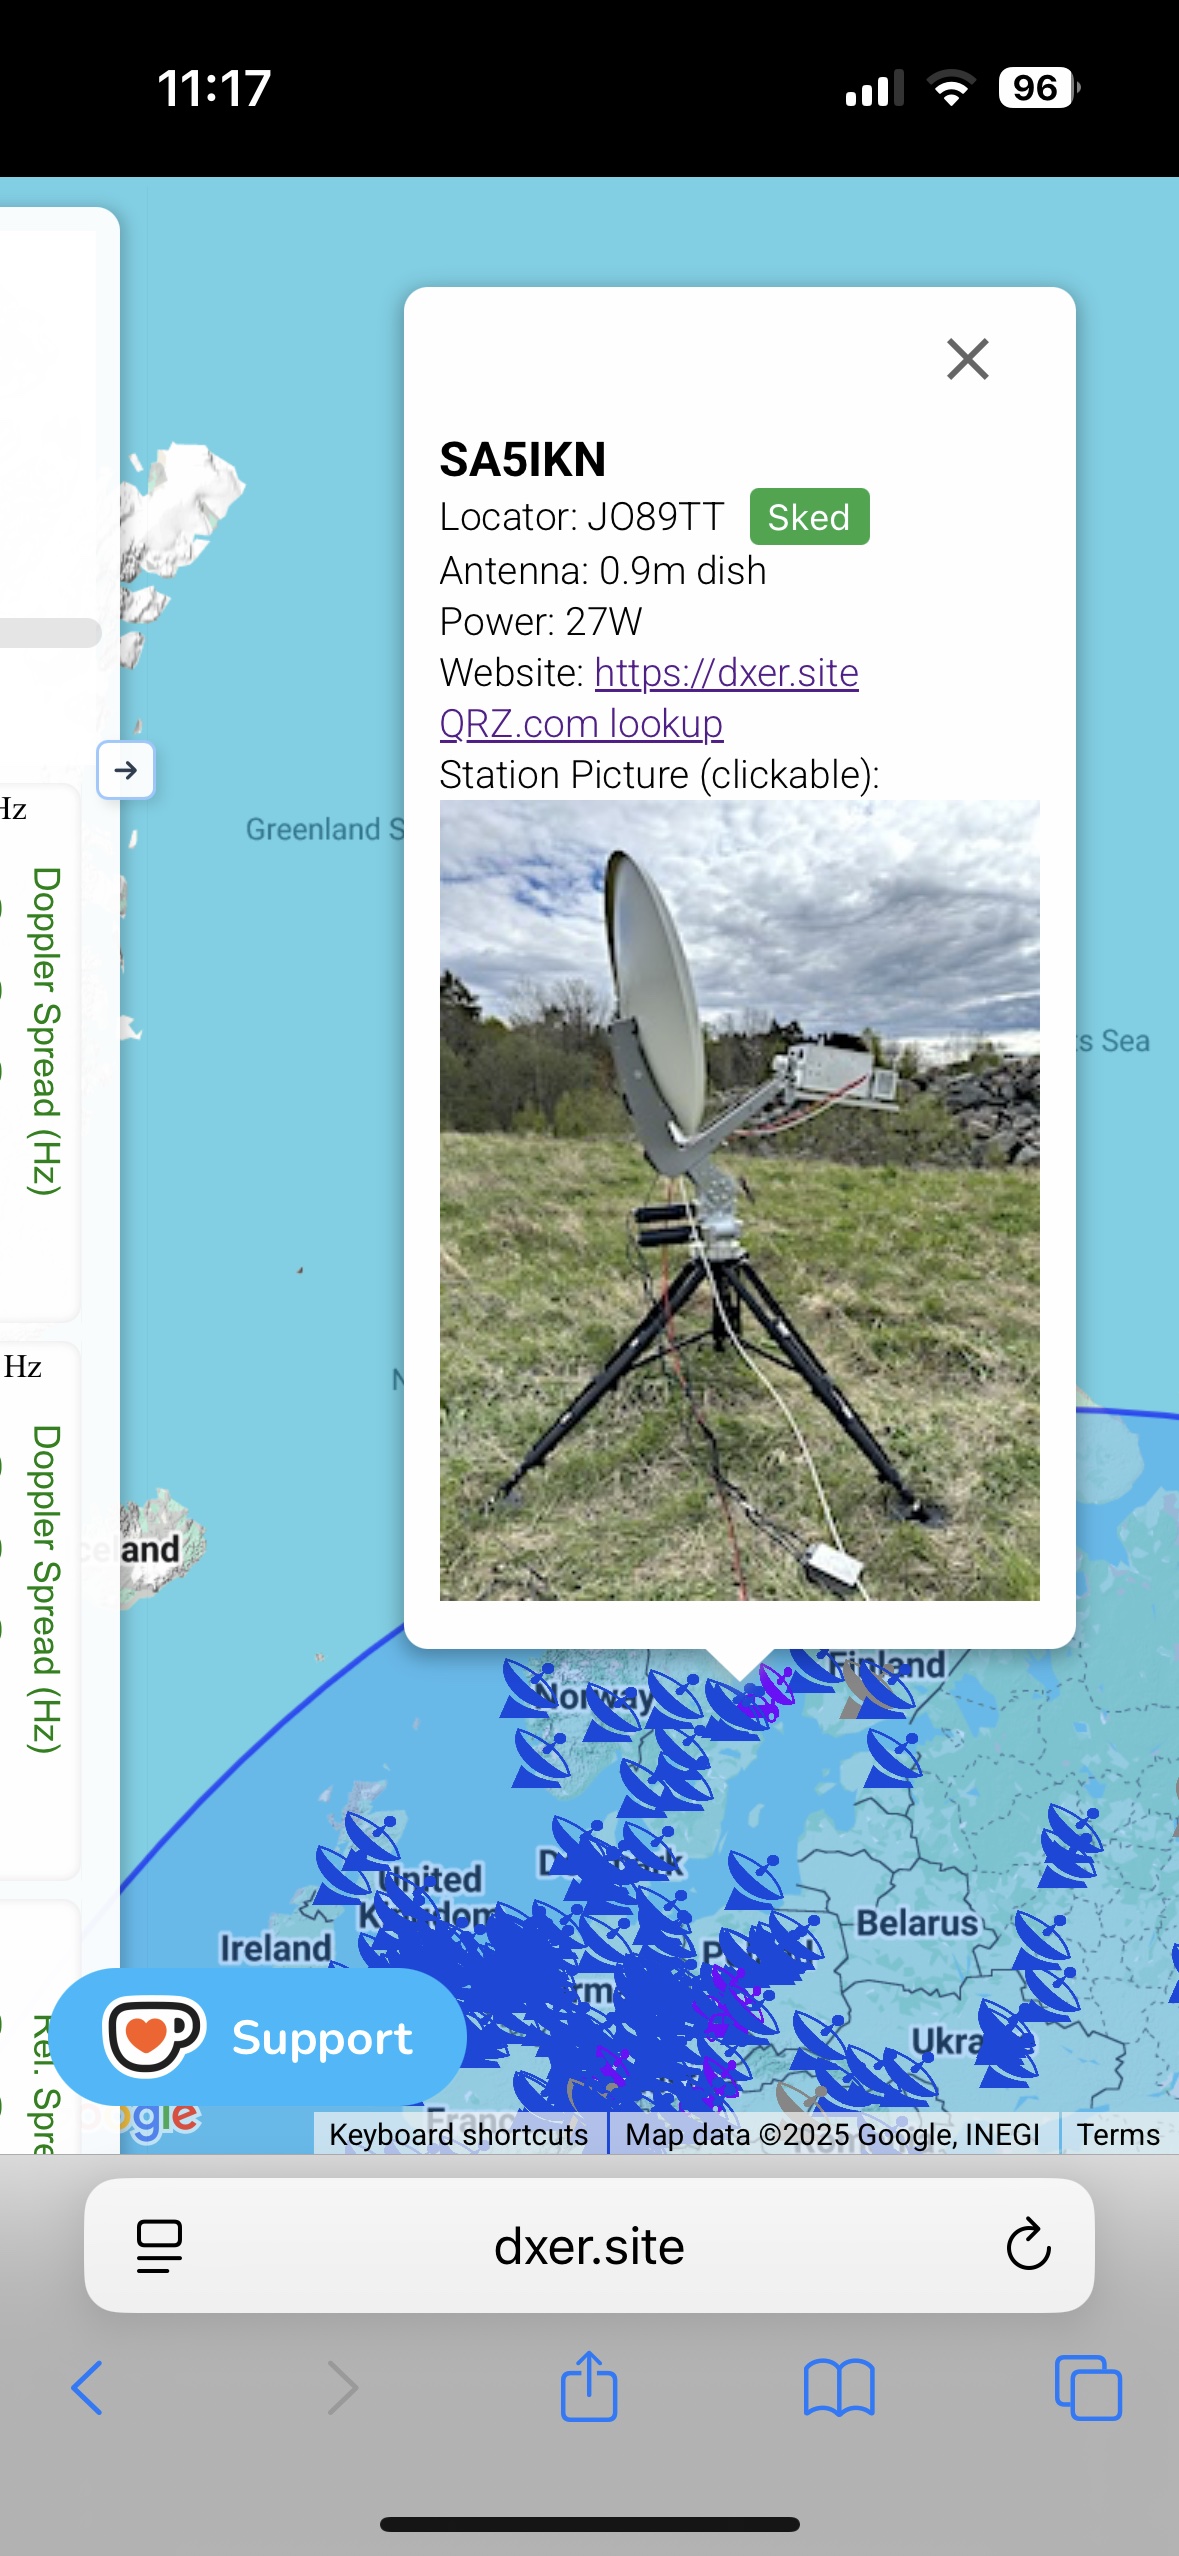
Station Map and Station Profiles
The map displays EME stations for the selected band using four distinct marker types:
-
 Home station (active) – a fixed-location EME station
-
 Home station (not active) – not active but known to QRV in the past
-
 DXpedition – a portable station operating outside its home QTH locator
-
 Silent Key – a station formerly active, now marked in memoriam
Clicking a marker opens an information window displaying the station profile. This includes the callsign, operator name, and QTH locator, along with a green Sked button for one-click sked planning. When the Sked button is pressed, information about the common moon windows between My Locator and the DX station’s locator for the selected date is displayed. Where available, additional details may be shown, such as antenna size, transmit power, a website link, a station photo, and a dedicated QRZ button providing direct access to the operator’s QRZ.com page. The blue Email button opens your default email client with the station’s address pre-filled, making it easy to arrange a sked.
When the Sked button is pressed, several outcomes are possible depending on the availability of common moon windows. If no common moon window exists for the selected date, the message No common moon window today is displayed. Up to three common moon windows may occur within a 24-hour period, depending on the date. All times are given in UTC. Because a moon window may cross midnight, the notation (-1) and (+1) is used to indicate times that fall on the previous or next UTC day, respectively.
Realtime Tracking Mode
EME Observer includes a Realtime Tracking mode, which can be activated by pressing the Track button. In this mode, the map and all metrics displayed on the charts and above them are updated at 1-minute intervals. This frequency is sufficient for assesment of the current Moon footprint and conditions, for example during contests or when running schedules. When Realtime Tracking mode is active, the time and date controls are greyed out, as shown in the screenshot above. To return to Manual mode for standard EME planning, click the Stop button. Note that the Realtime Tracking mode automatically deactivates if band is changed.
Table View
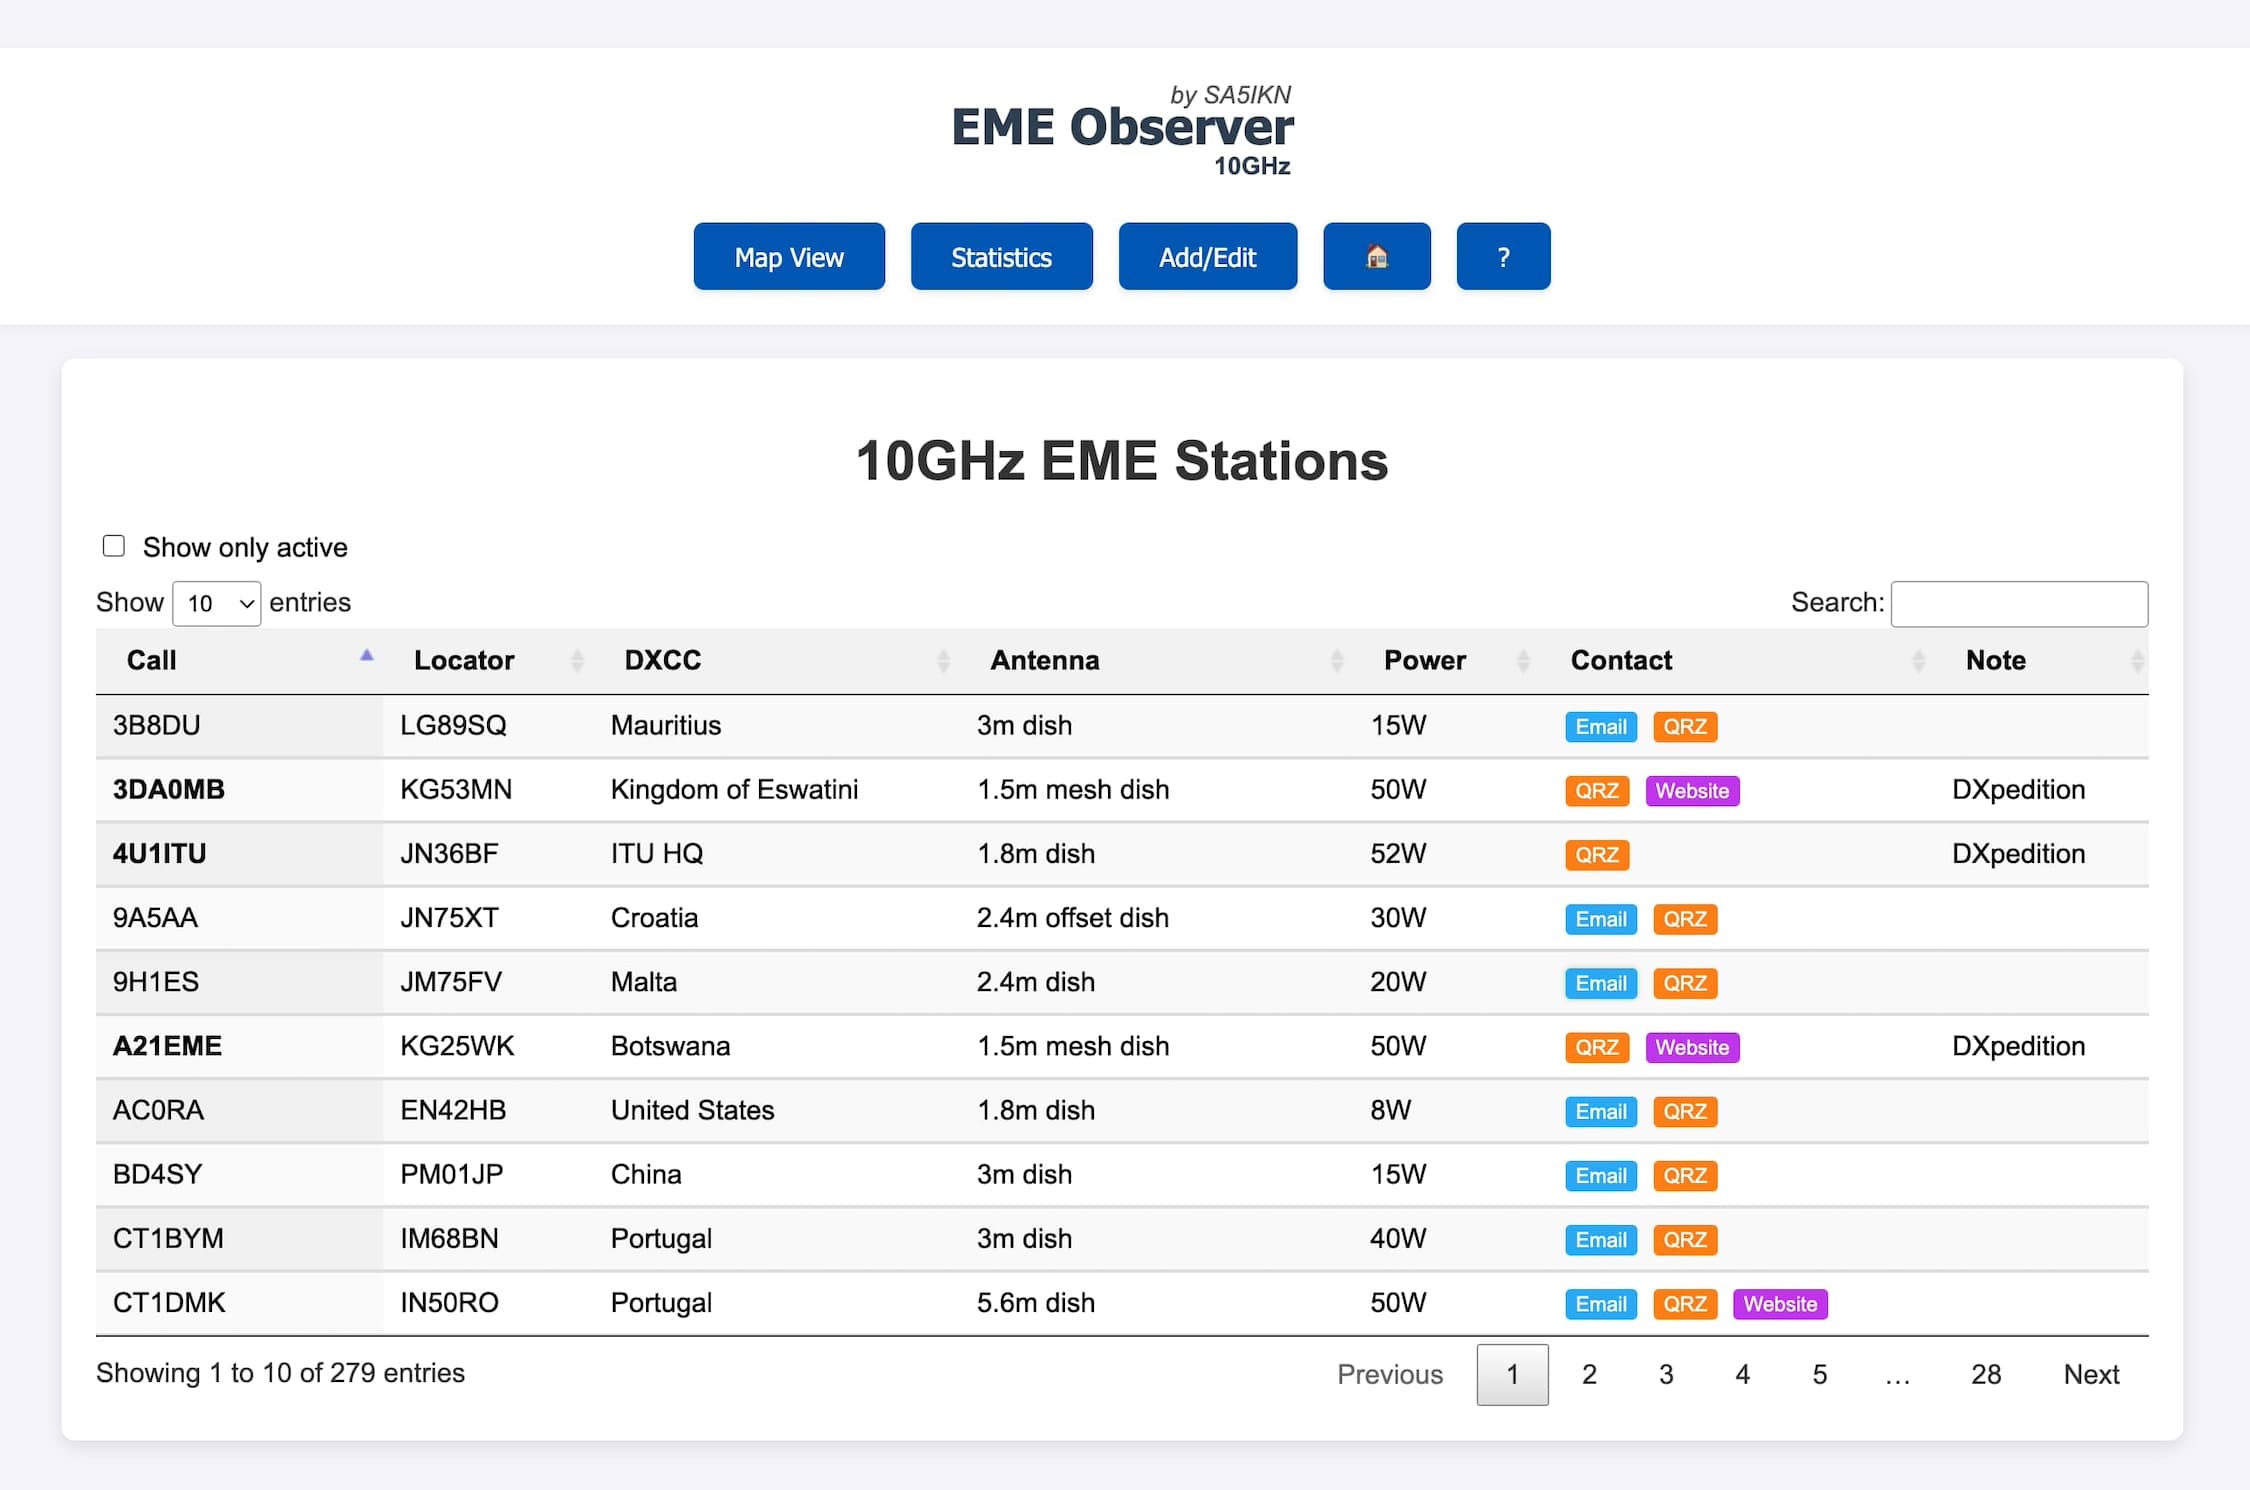
The Table View can be accessed by clicking the Table View button in the Control Panel. This mode provides a detailed, sortable, and customizable table of EME stations for each band, which can be selected via a drop-down menu. Each row presents key station information: callsign, QTH locator, DXCC entity, antenna type, transmit power, and any available notes. When contact details are provided, Email, QRZ, and Website buttons are shown, allowing quick access to external resources or direct communication.
The table includes a full-text search across all columns, making it easy to filter stations by DXCC prefix, power level, antenna type or size, and other parameters. You can sort by any column or combine search criteria to efficiently locate stations of interest.
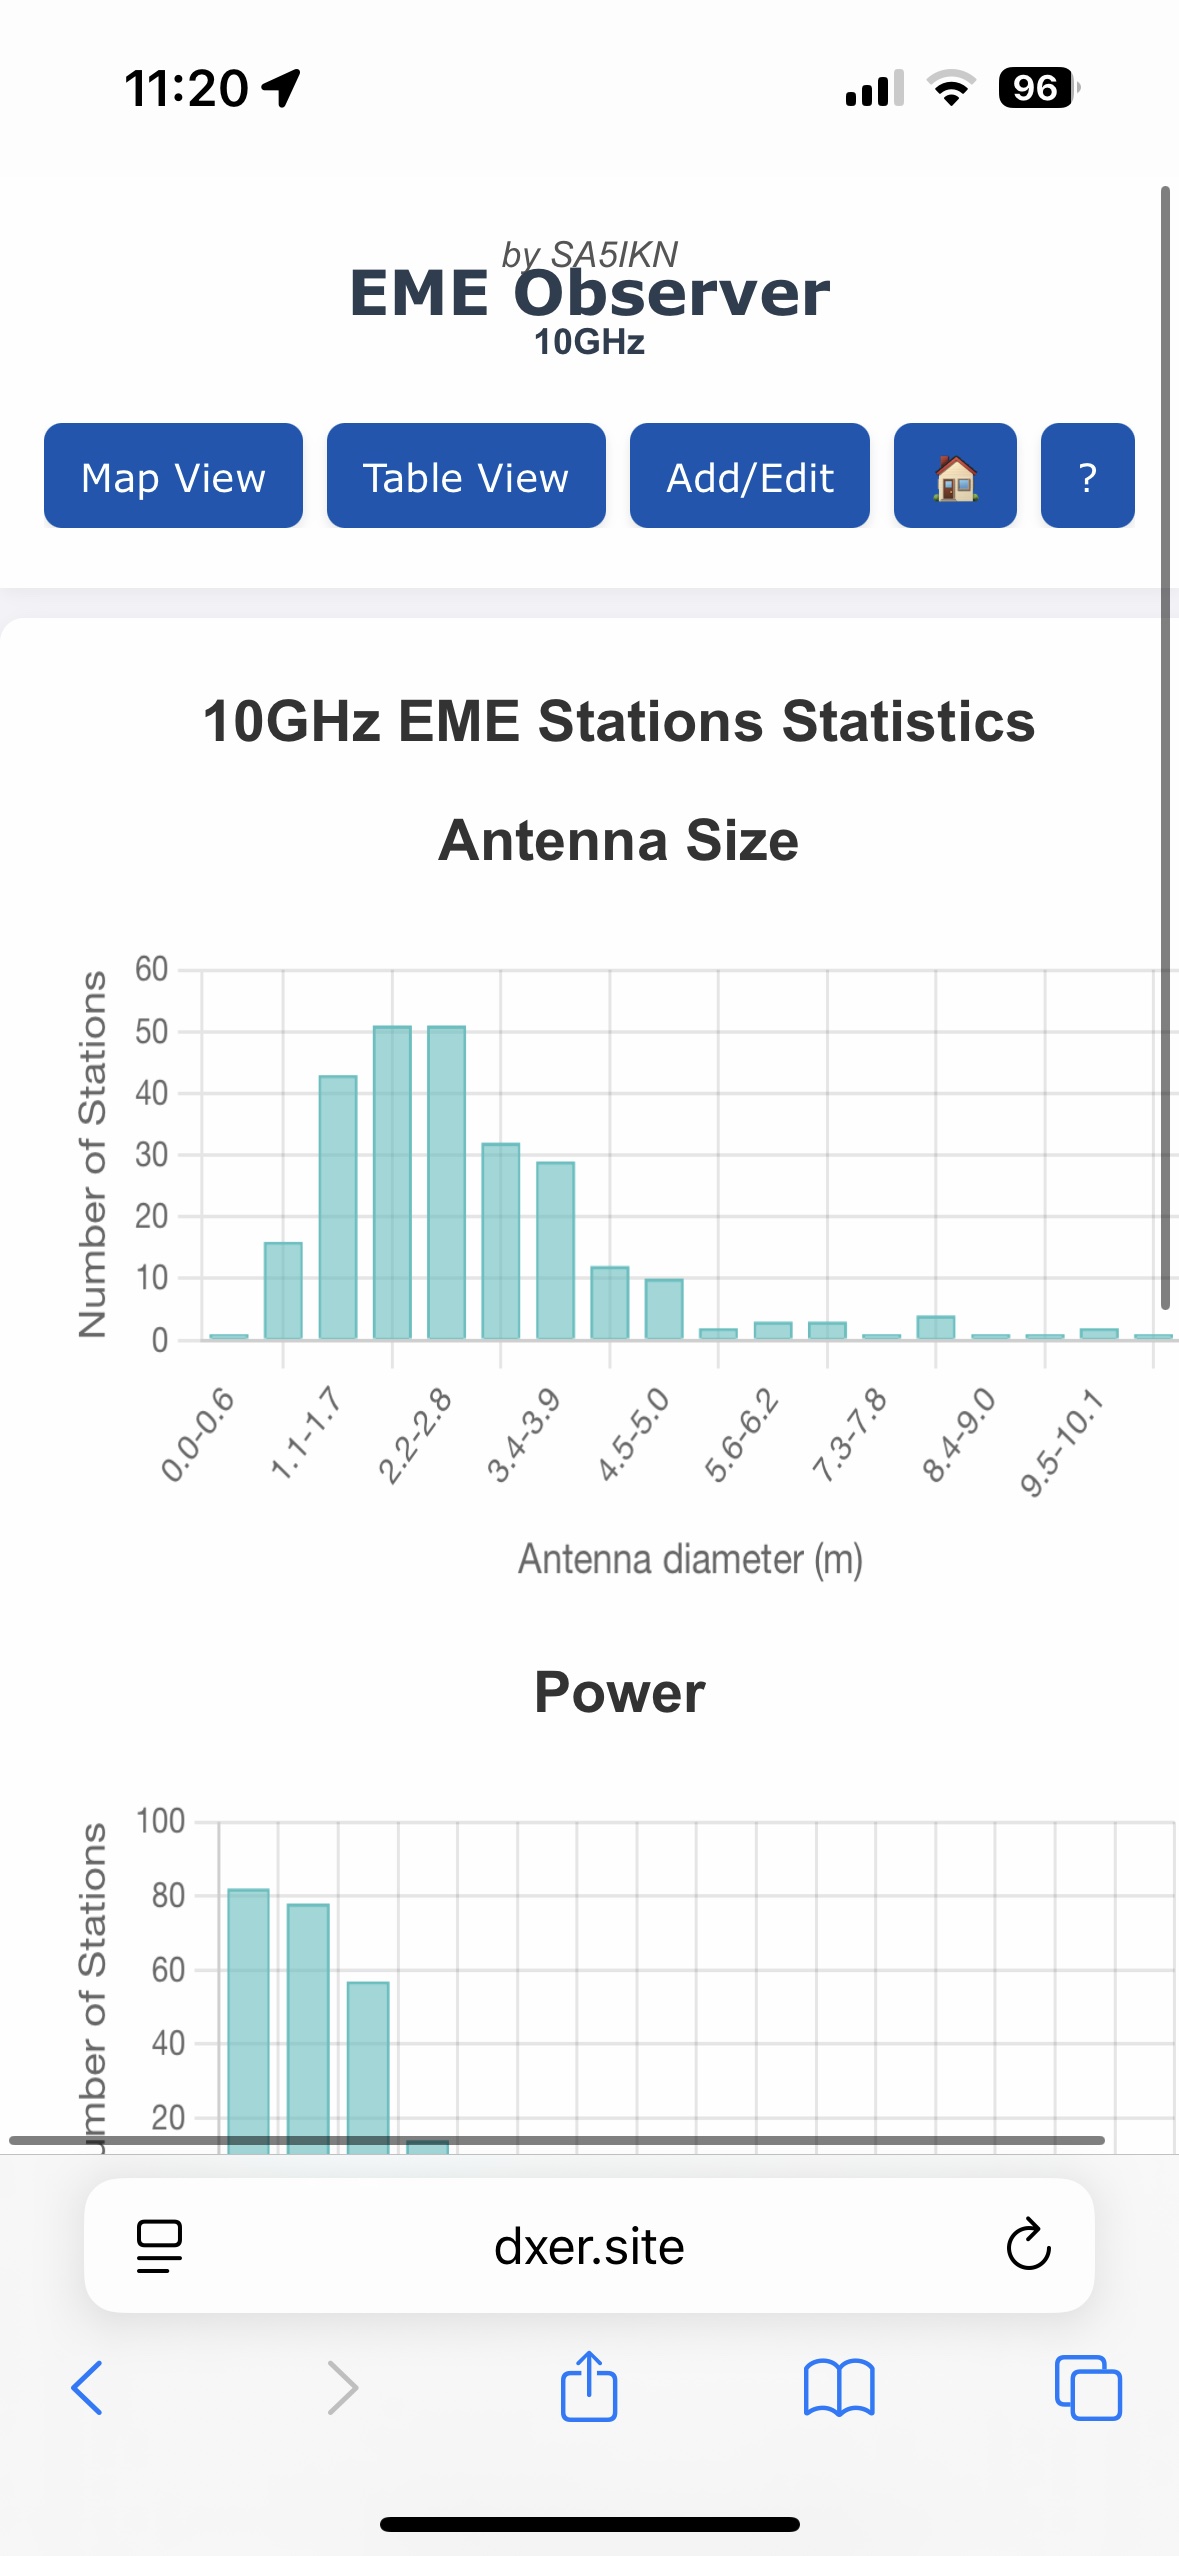
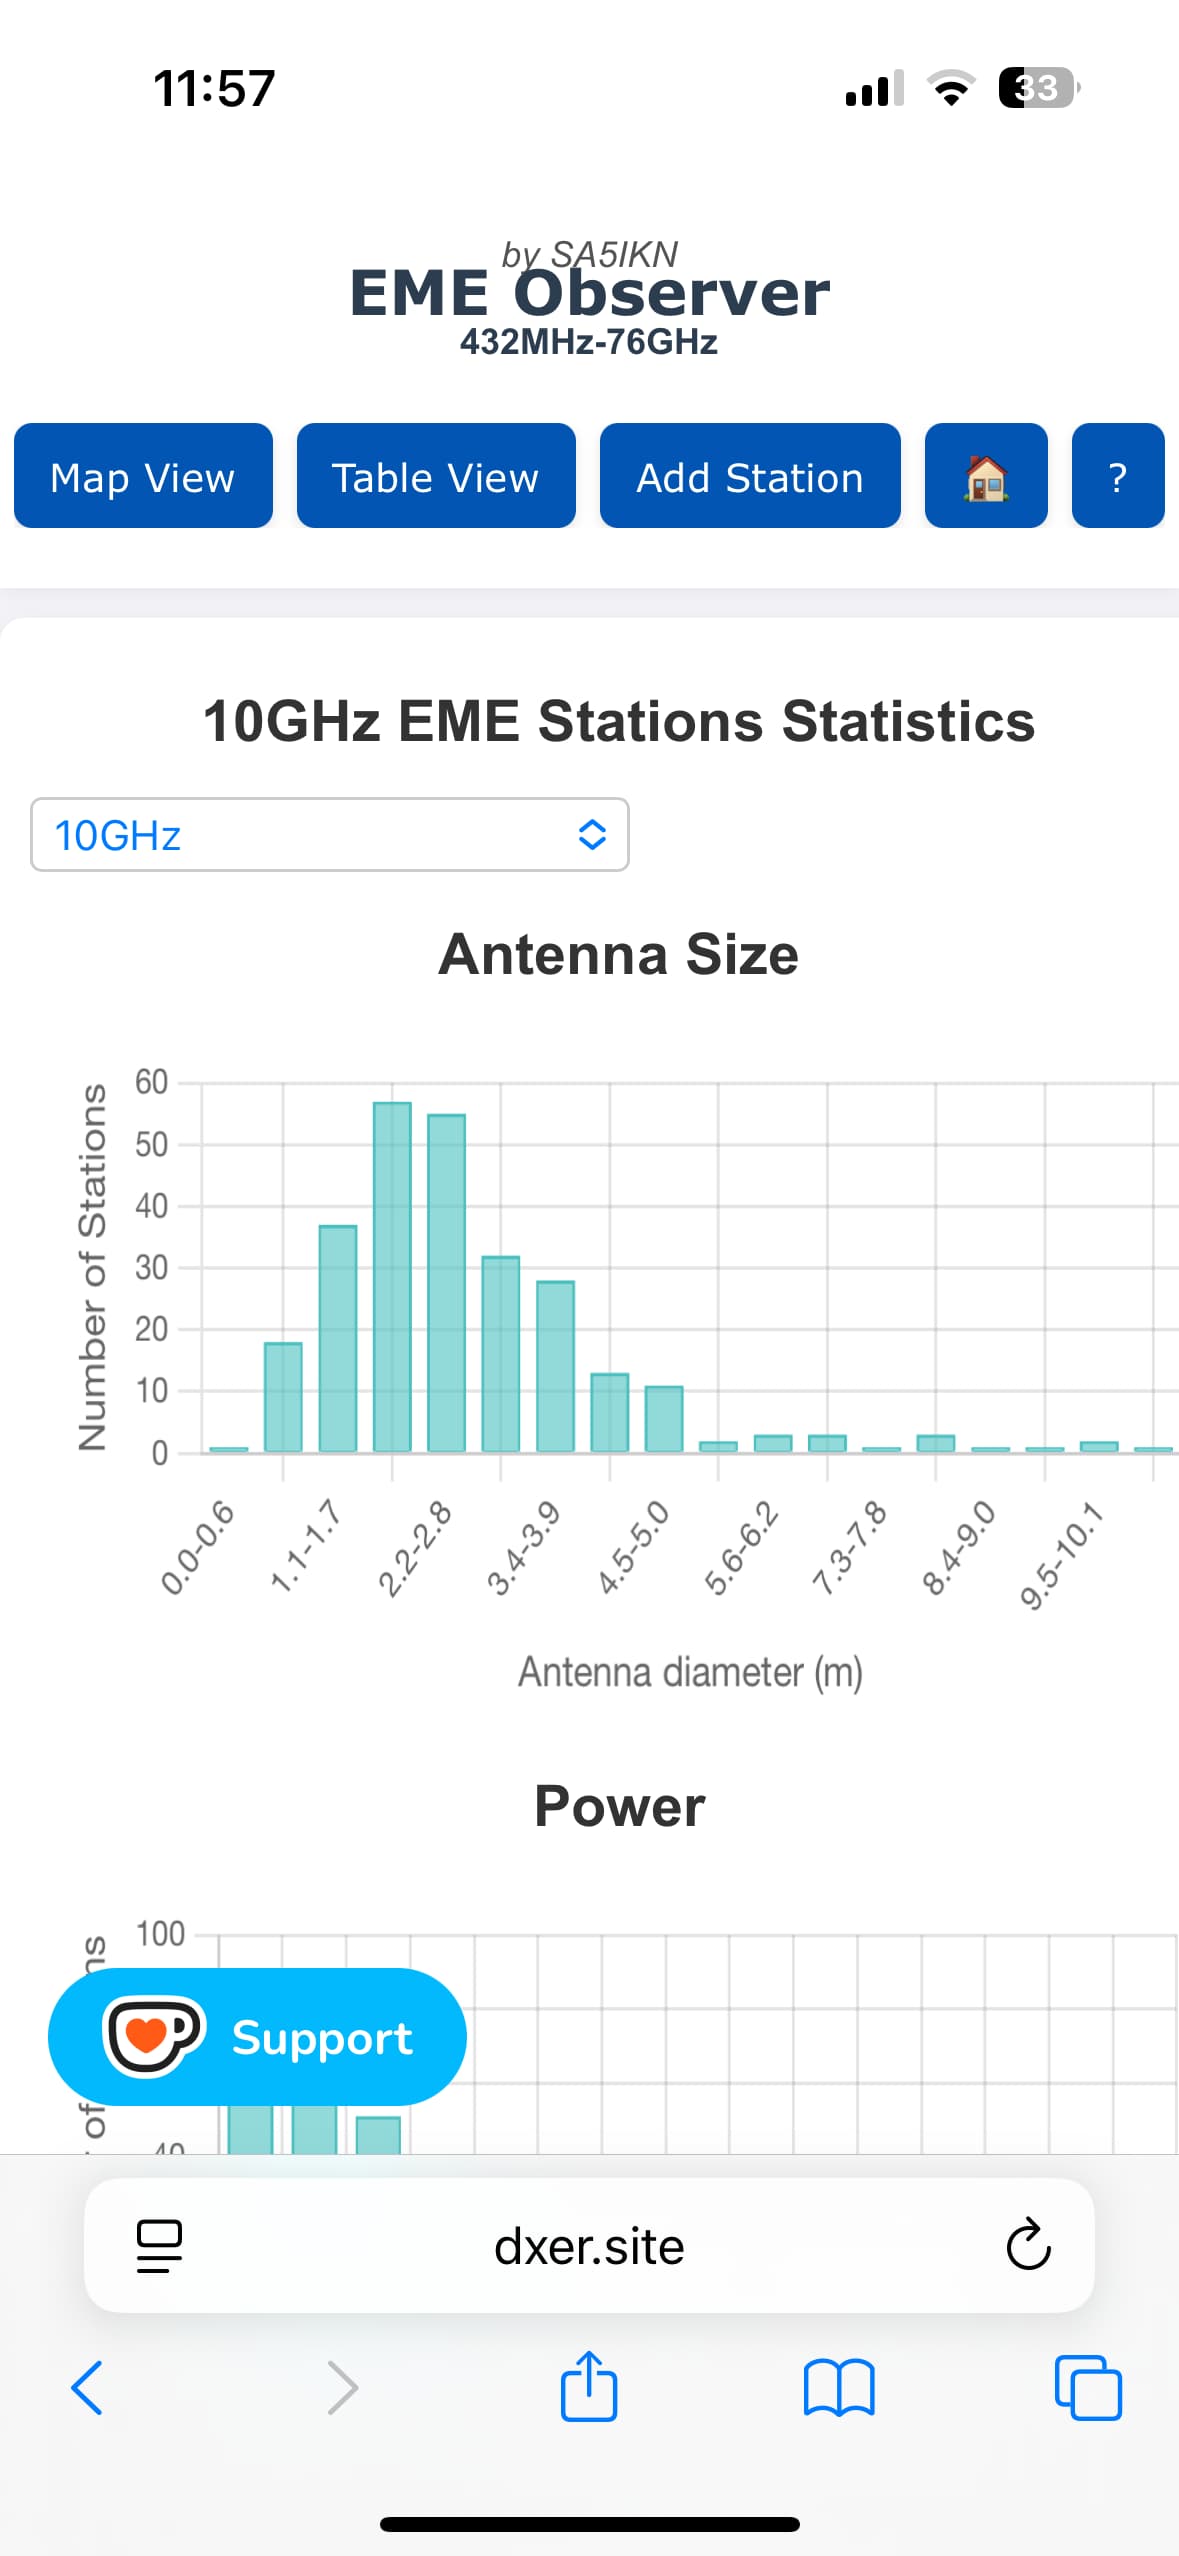
Statistics View
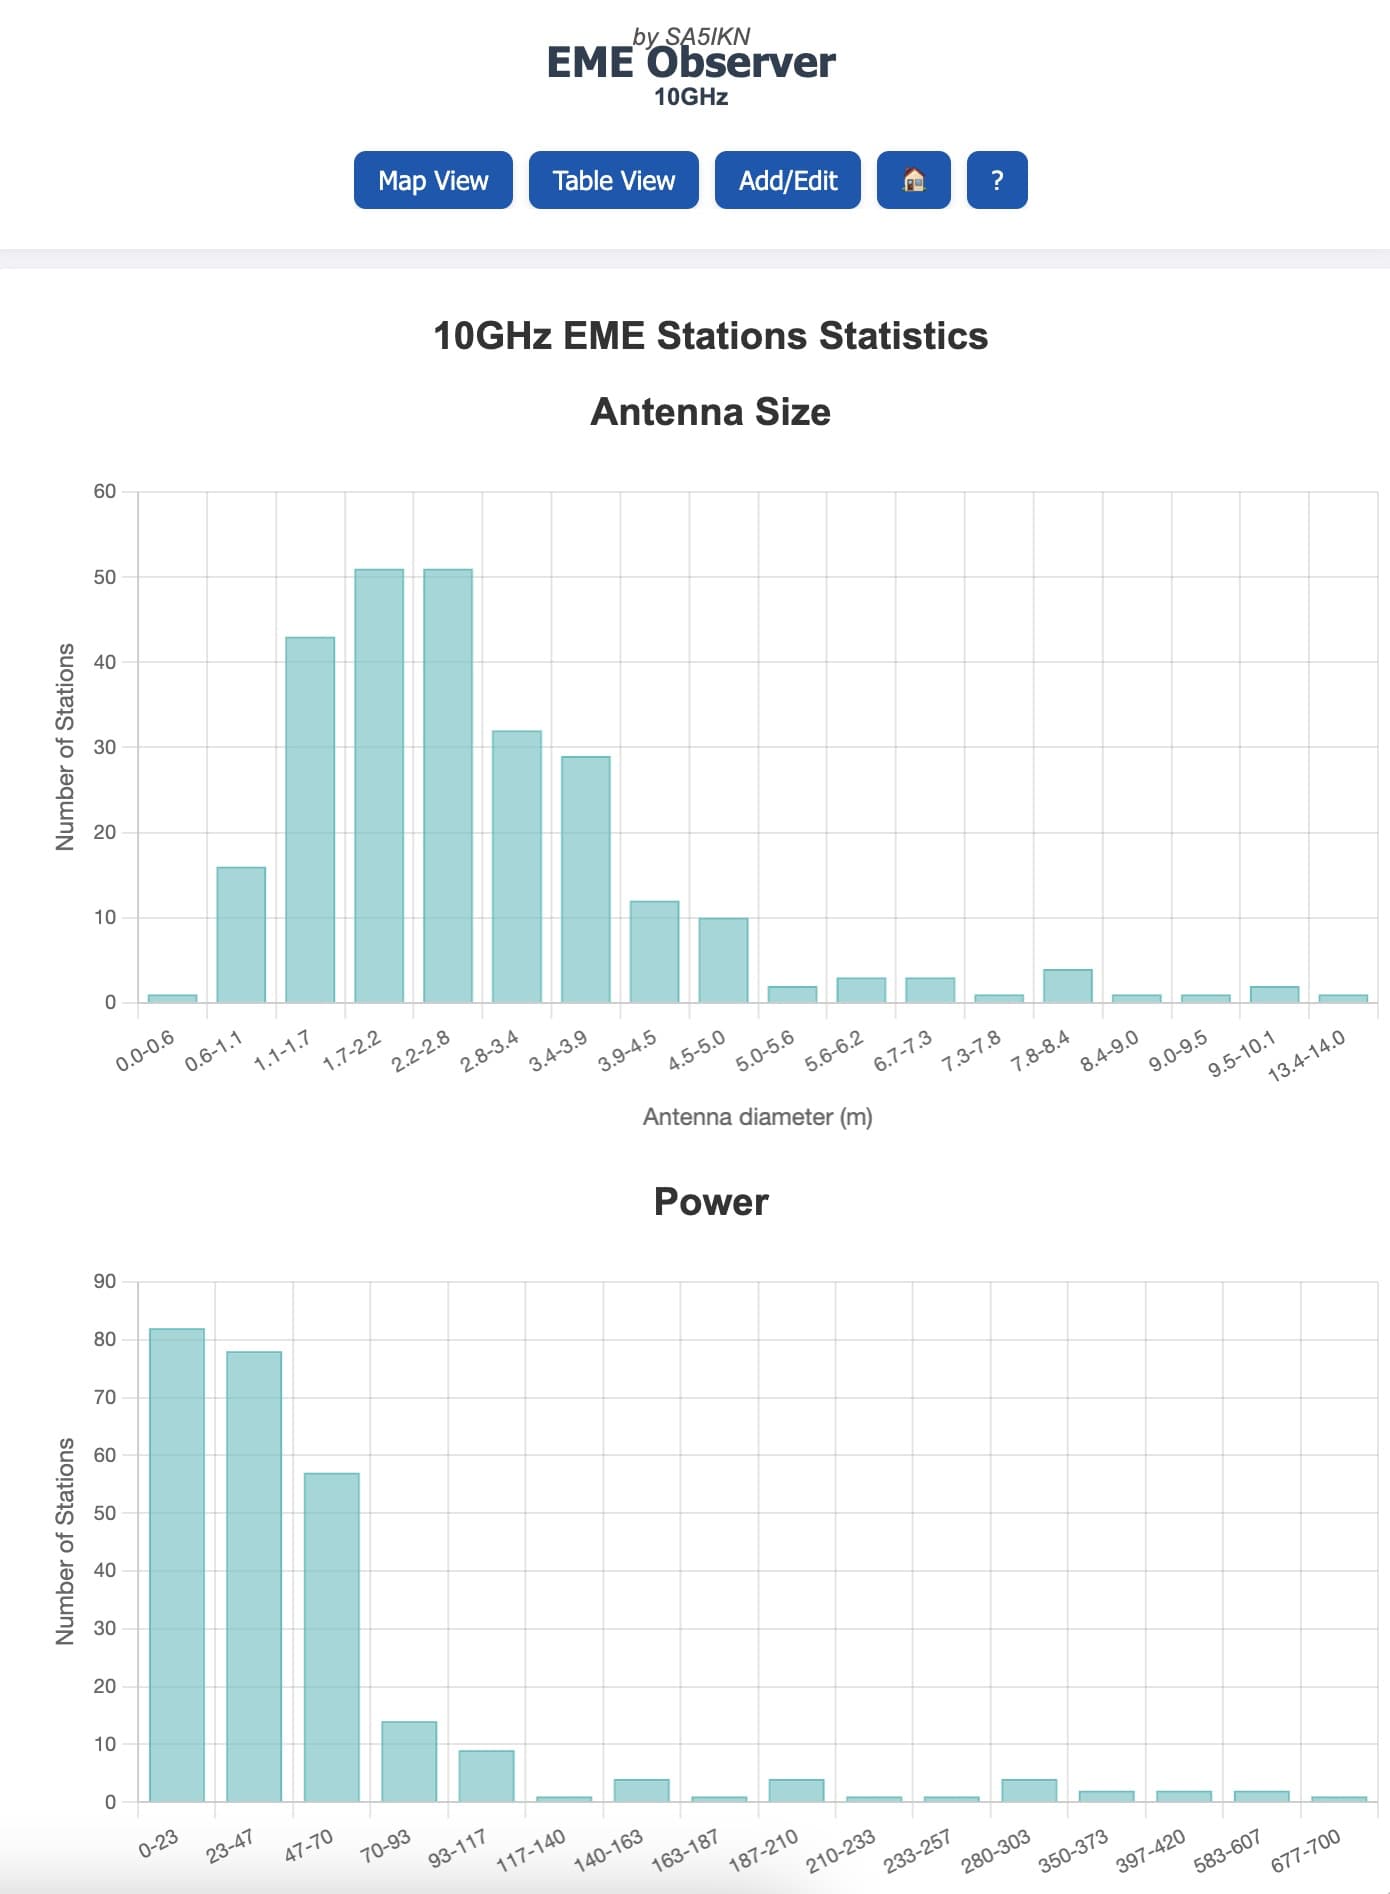
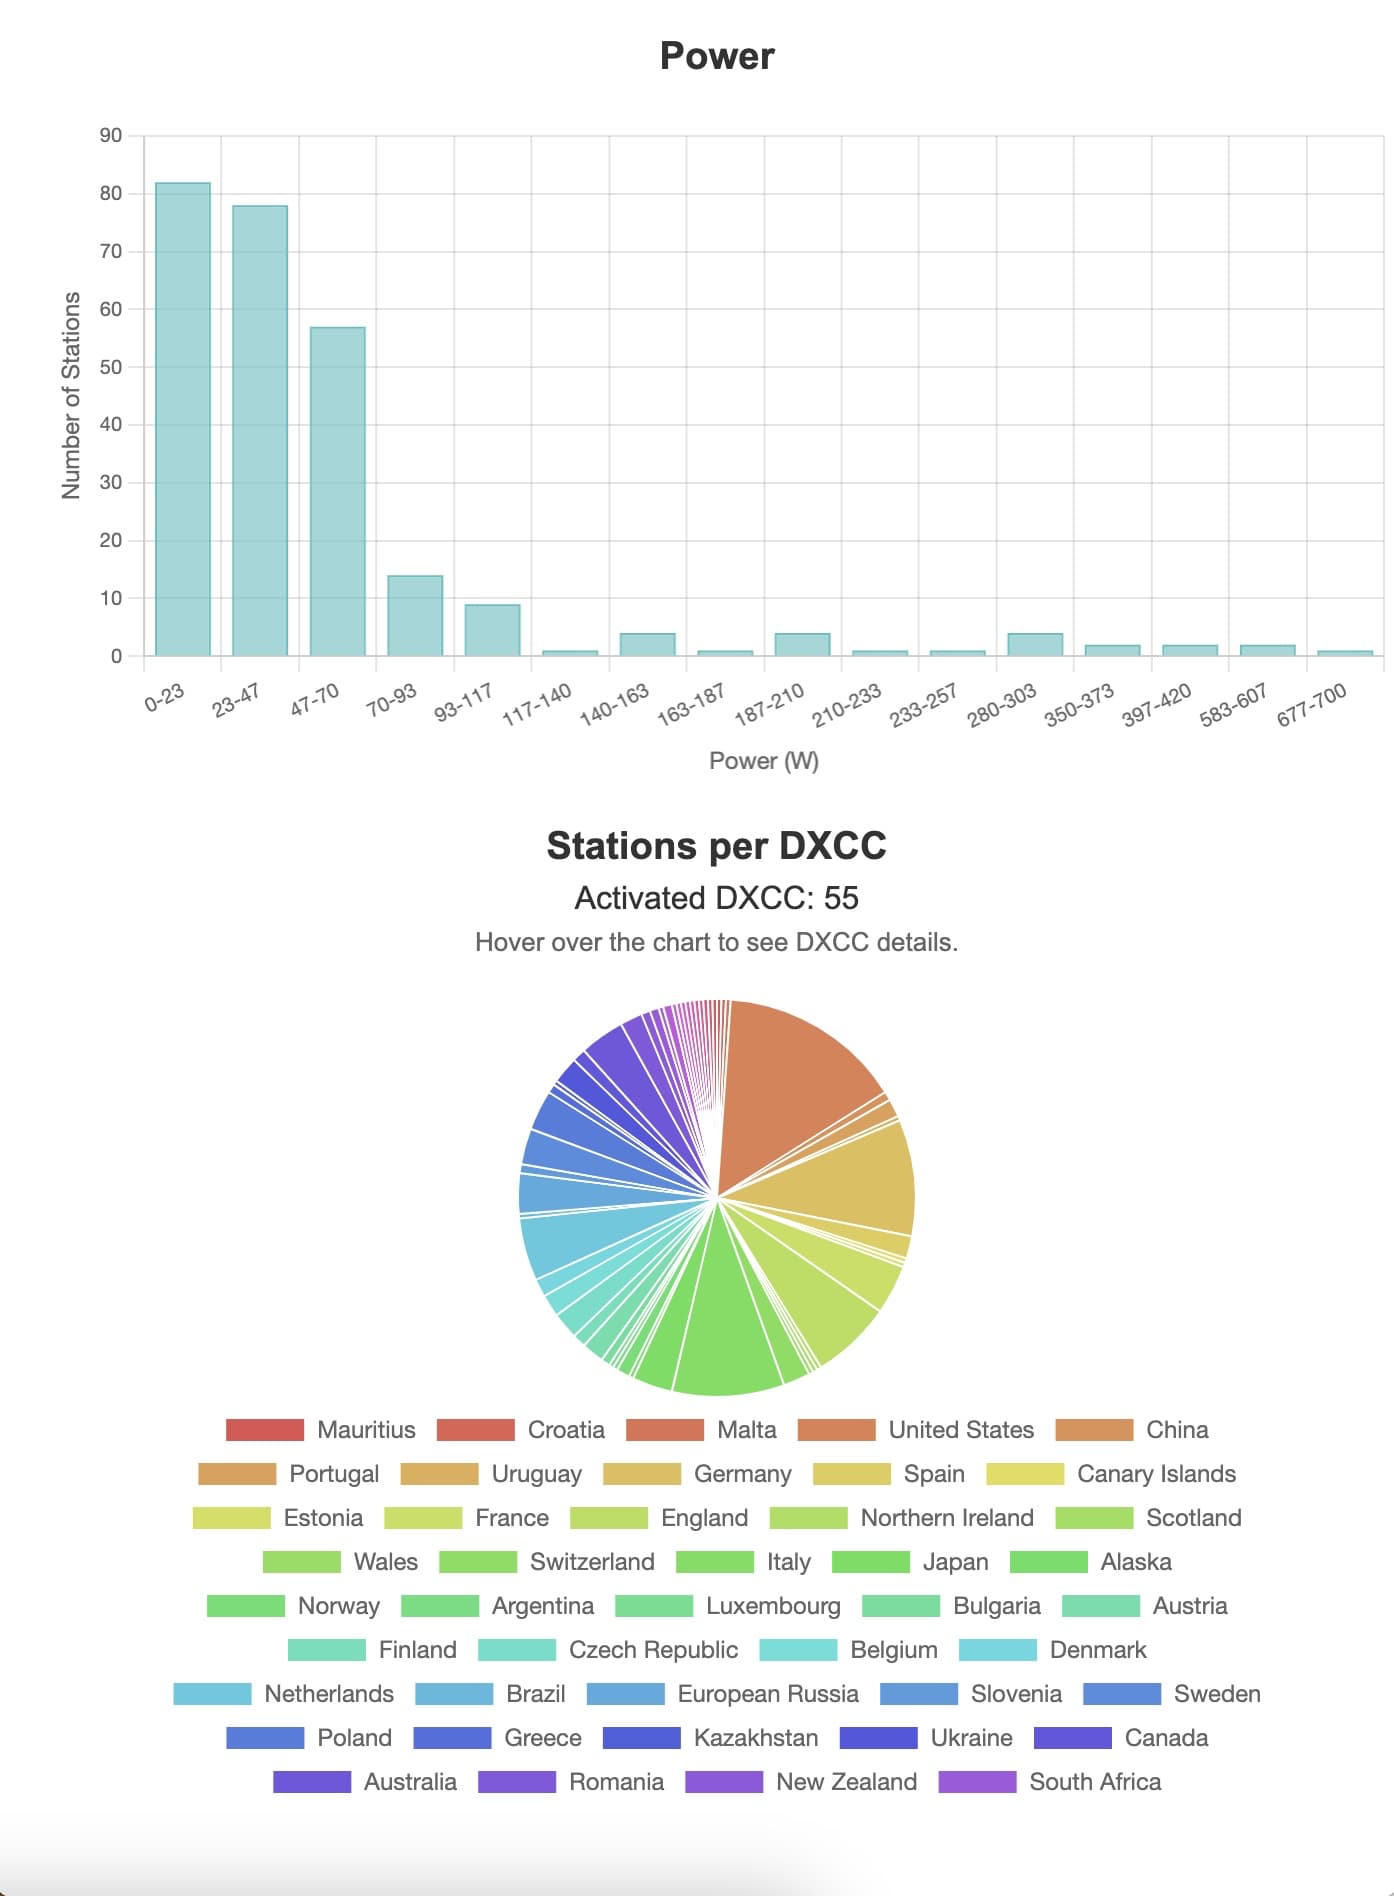
The Statistics View can be accessed from the Control Panel. This mode displays dynamic charts illustrating the distribution of stations by antenna size (dish diameter or number of Yagi elements combined across all booms in the antenna system), transmit power, and DXCC entity. These statistics are automatically refreshed whenever station data is added or updated. Select band via the band selector.
Mobile experience
EME Observer features a responsive design optimized for mobile devices, presenting all essential data in a compact, touch-friendly layout. The screenshots below show the interface as displayed on an iPhone Pro. On smaller screens, vertical scrolling is enabled for charts, allowing users to explore data easily while key controls remain fixed for quick access. The control panel can be minimized using the Hide Panel button (←), making it easier to explore the map, Moon footprint, CQ Zones, QTH Locators, and station profiles. One-click sked planning functions identically to the desktop version and so does the Realtime Tracking Mode.

A Note on Libration Rate and Doppler Spread
EME Observer displays the full limb-to-limb lunar libration rate and Doppler spread. If the beamwidth of your antenna is smaller than the apparent angular diameter of the Moon in the sky (approximately 0.5 degrees), the libration rate and Doppler spread actually observed by your system will be reduced. Consequently, the relative (added as vectors) libration rate and relative Doppler spread between your location and the DX location will also be smaller. This effect becomes increasingly significant on higher microwave bands, where antenna beamwidth decreases as frequency increases.
The quantitative and qualitative effects of lunar libration vary strongly with frequency. On the lower EME bands, libration is relatively small and primarily manifests as Doppler fading. On the higher microwave bands, libration effects are much larger and appear as Doppler spread (also referred to in the EME literature as Doppler spreading, libration spreading, signal smearing, signal width, etc).
A Note on Spatial Polarisation Offset (Dpol)
Spatial polarisation offset is especially important to consider on the higher EME bands, 10GHz and above. On these bands, antennas are typically linearly polarised, and Faraday rotation is negligible, so any observed polarisation mismatch is primarily due to spatial effects. On the lower EME bands (144-432 MHz), linear polarisation is also commonly used, but Faraday rotation is significant. In this case, spatial polarisation offset interacts with Faraday rotation, and the two effects may add or partially cancel. Knowing the Dpol value helps identify conditions where path non-reciprocity may occur and can explain unexpected signal variations. On bands where circular polarisation is used (1296MHz-5760MHz), the effects of both spatial polarisation offset and Faraday rotation are effectively eliminated.
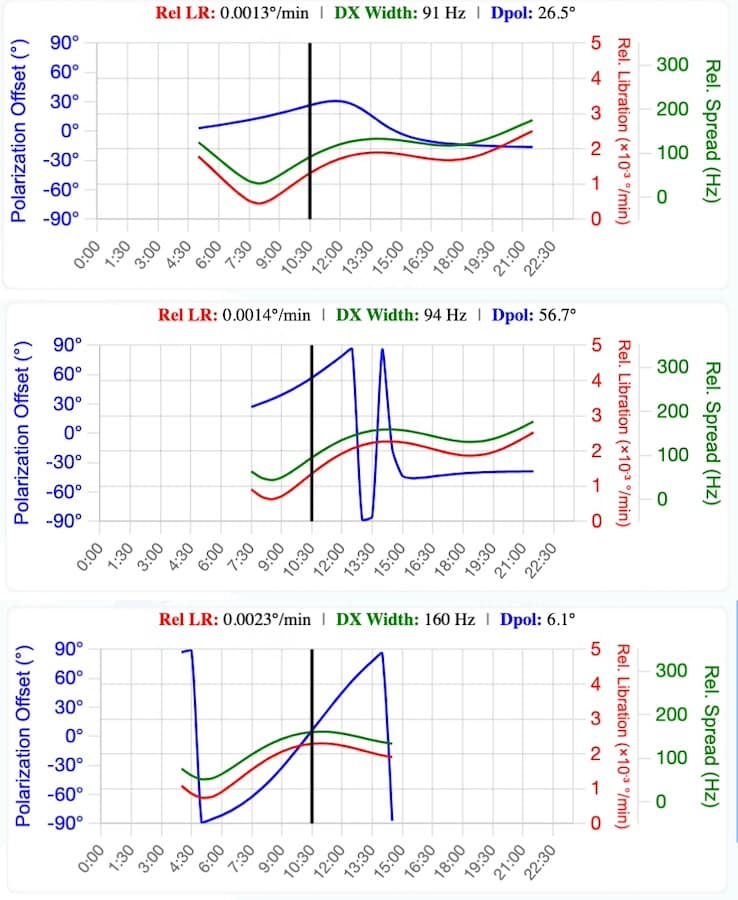
Under certain EME path geometries, the plot of the Spatial Polarisation Offset (Dpol) may show abrupt transitions in which the value appears to flip sign near ±90 degrees (see the middle and lower panels in the example below). The Dpol values reported by EME Observer are consistent with those produced by WSJT-X. When instantaneous values from WSJT-X are plotted in the same way, similar transitions are observed.
These rapid sign changes do not represent sudden physical changes in polarization. Instead, they arise because the Dpol function is mathematically constrained (“wrapped”) to the ±90-degree range. As the true polarization angle passes beyond this range, the wrapped value appears to jump abruptly. This behaviour reflects the fact that linear polarisation angles separated by 180° are physically equivalent, only the phase is inverted, not the polarisation orientation. For additional details, see this discussion.
Support EME Observer
If you enjoy using EME Observer and want to help cover website costs, you can contribute in one of these ways:
- PayPal (Friends & Family): Send your contribution directly to SA5IKN's email: shown on QRZ.com. Using Friends & Family avoids fees, so your full support goes to the project.
-
Ko-fi: Support via Ko-fi quickly and easily:
Current supporters:
- F2CT
- ON5TA
- F5JWF
- F6IJI
- DC1RDB
- I6YPK
- KG0D
- N2END
Every contribution, big or small, helps keep EME Observer online and available for the community. Thank you for your support!
Licenses and Credits
EME Observer
© 2025-2026 Max Romensky (SA5IKN). All rights reserved.
This application incorporates the following third-party components:
- NASA JPL DE421 Ephemeris - Public domain data provided by NASA’s Jet Propulsion Laboratory.
- Skyfield © 2014-2025 Brandon Rhodes and contributors - Licensed under the MIT License.
- Astronomy Engine © 2019-2025 Don Cross - Licensed under the MIT License.
- CQ Zones and Maidenhead Layers © 2025 HA8TKS - Licensed under the MIT License.
- Great Circle Plugin © 2018 Alex Wellerstein - Licensed under the MIT License.
- EME Directory - Public domain data provided by Jan Kappert (PA0PLY).
Certain astronomical algorithms implemented in EME Observer are based on methods published in Astronomical Algorithms (2nd Edition, 1998) by Jean Meeus. These are mathematical in nature and are not subject to copyright.